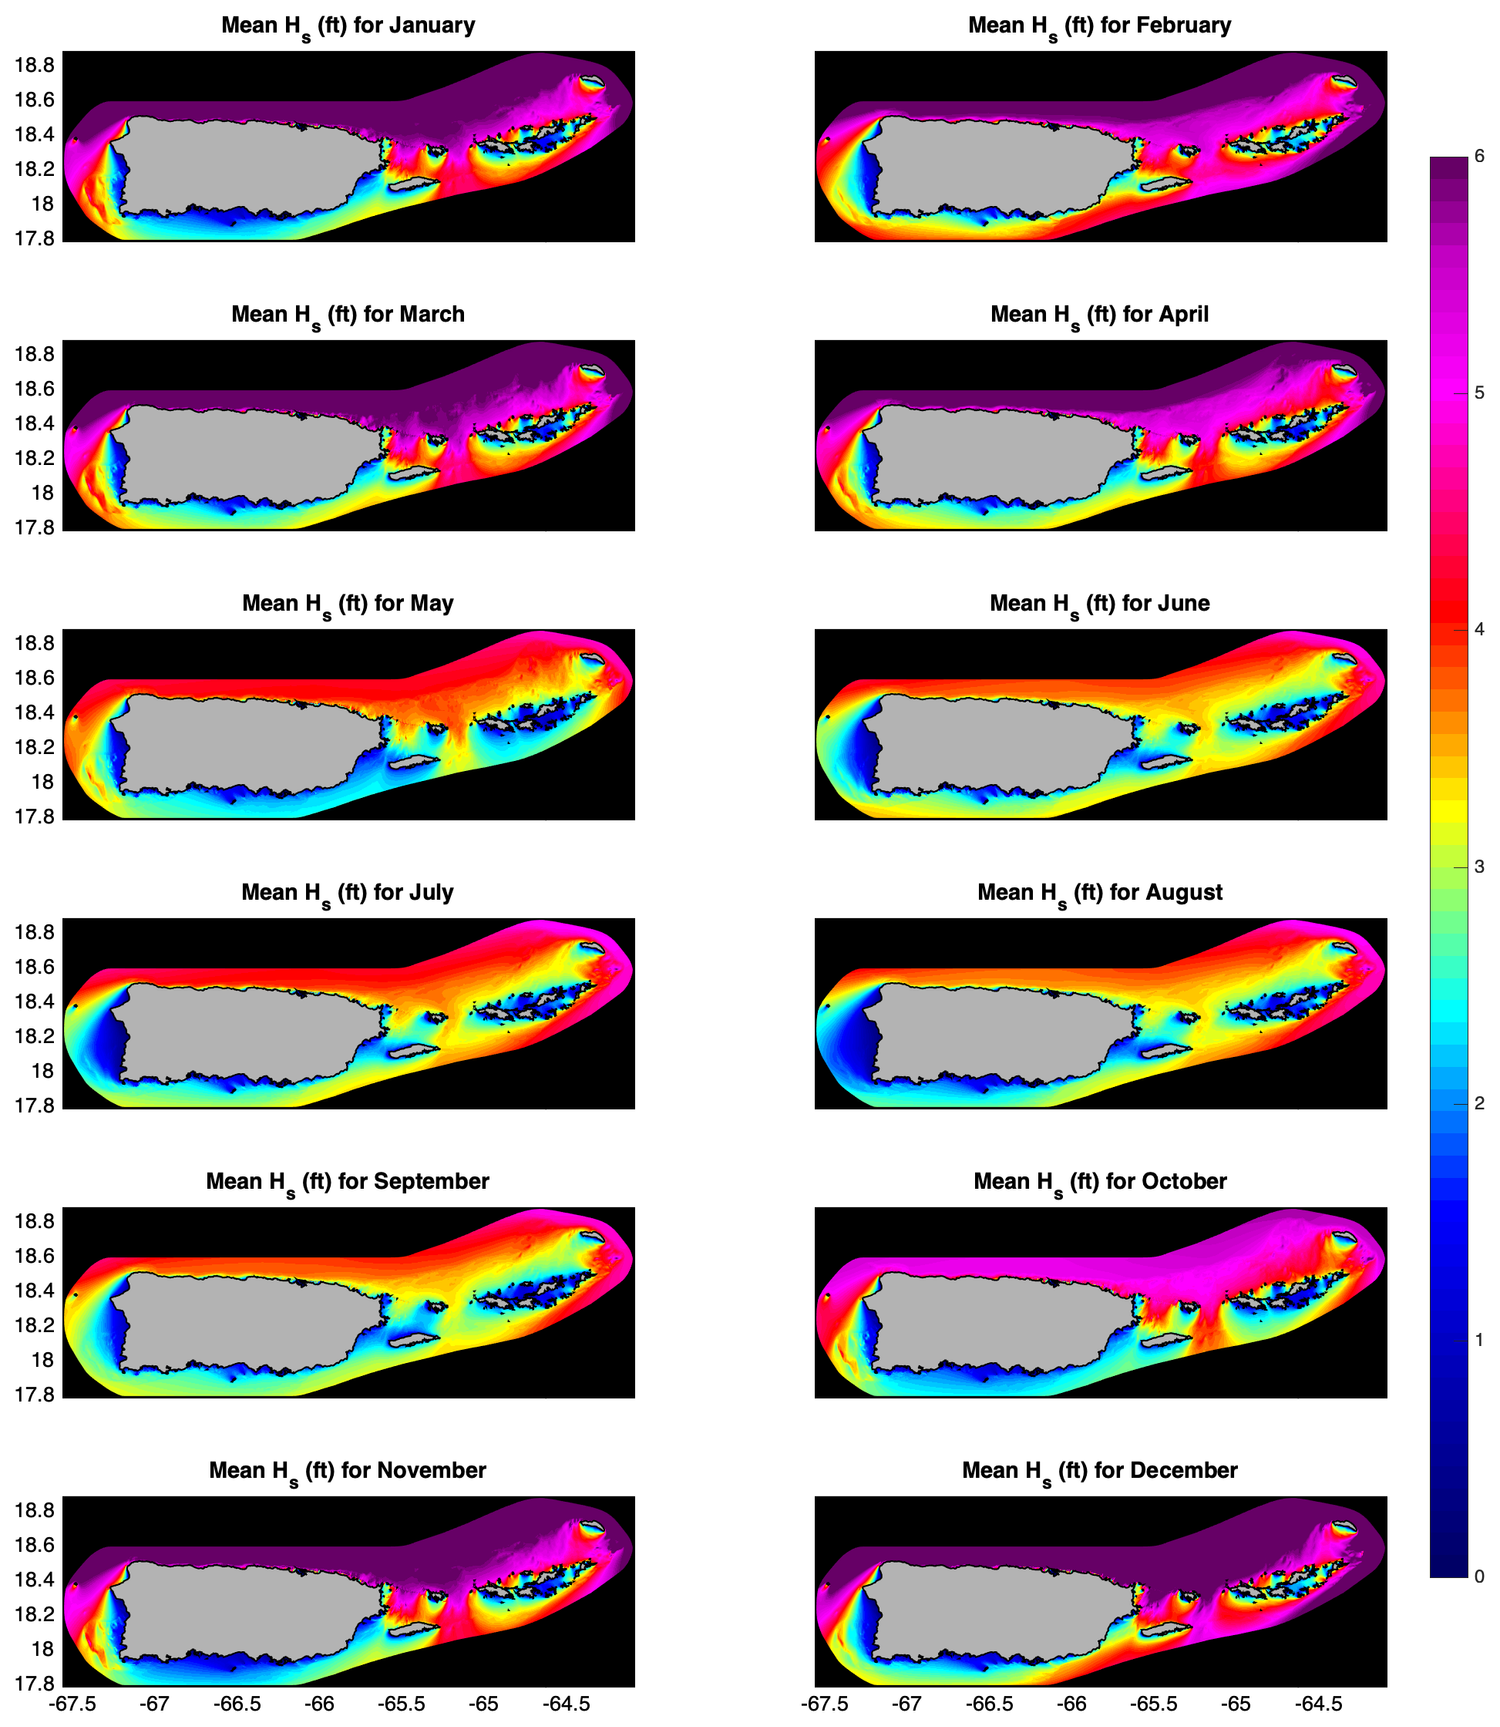
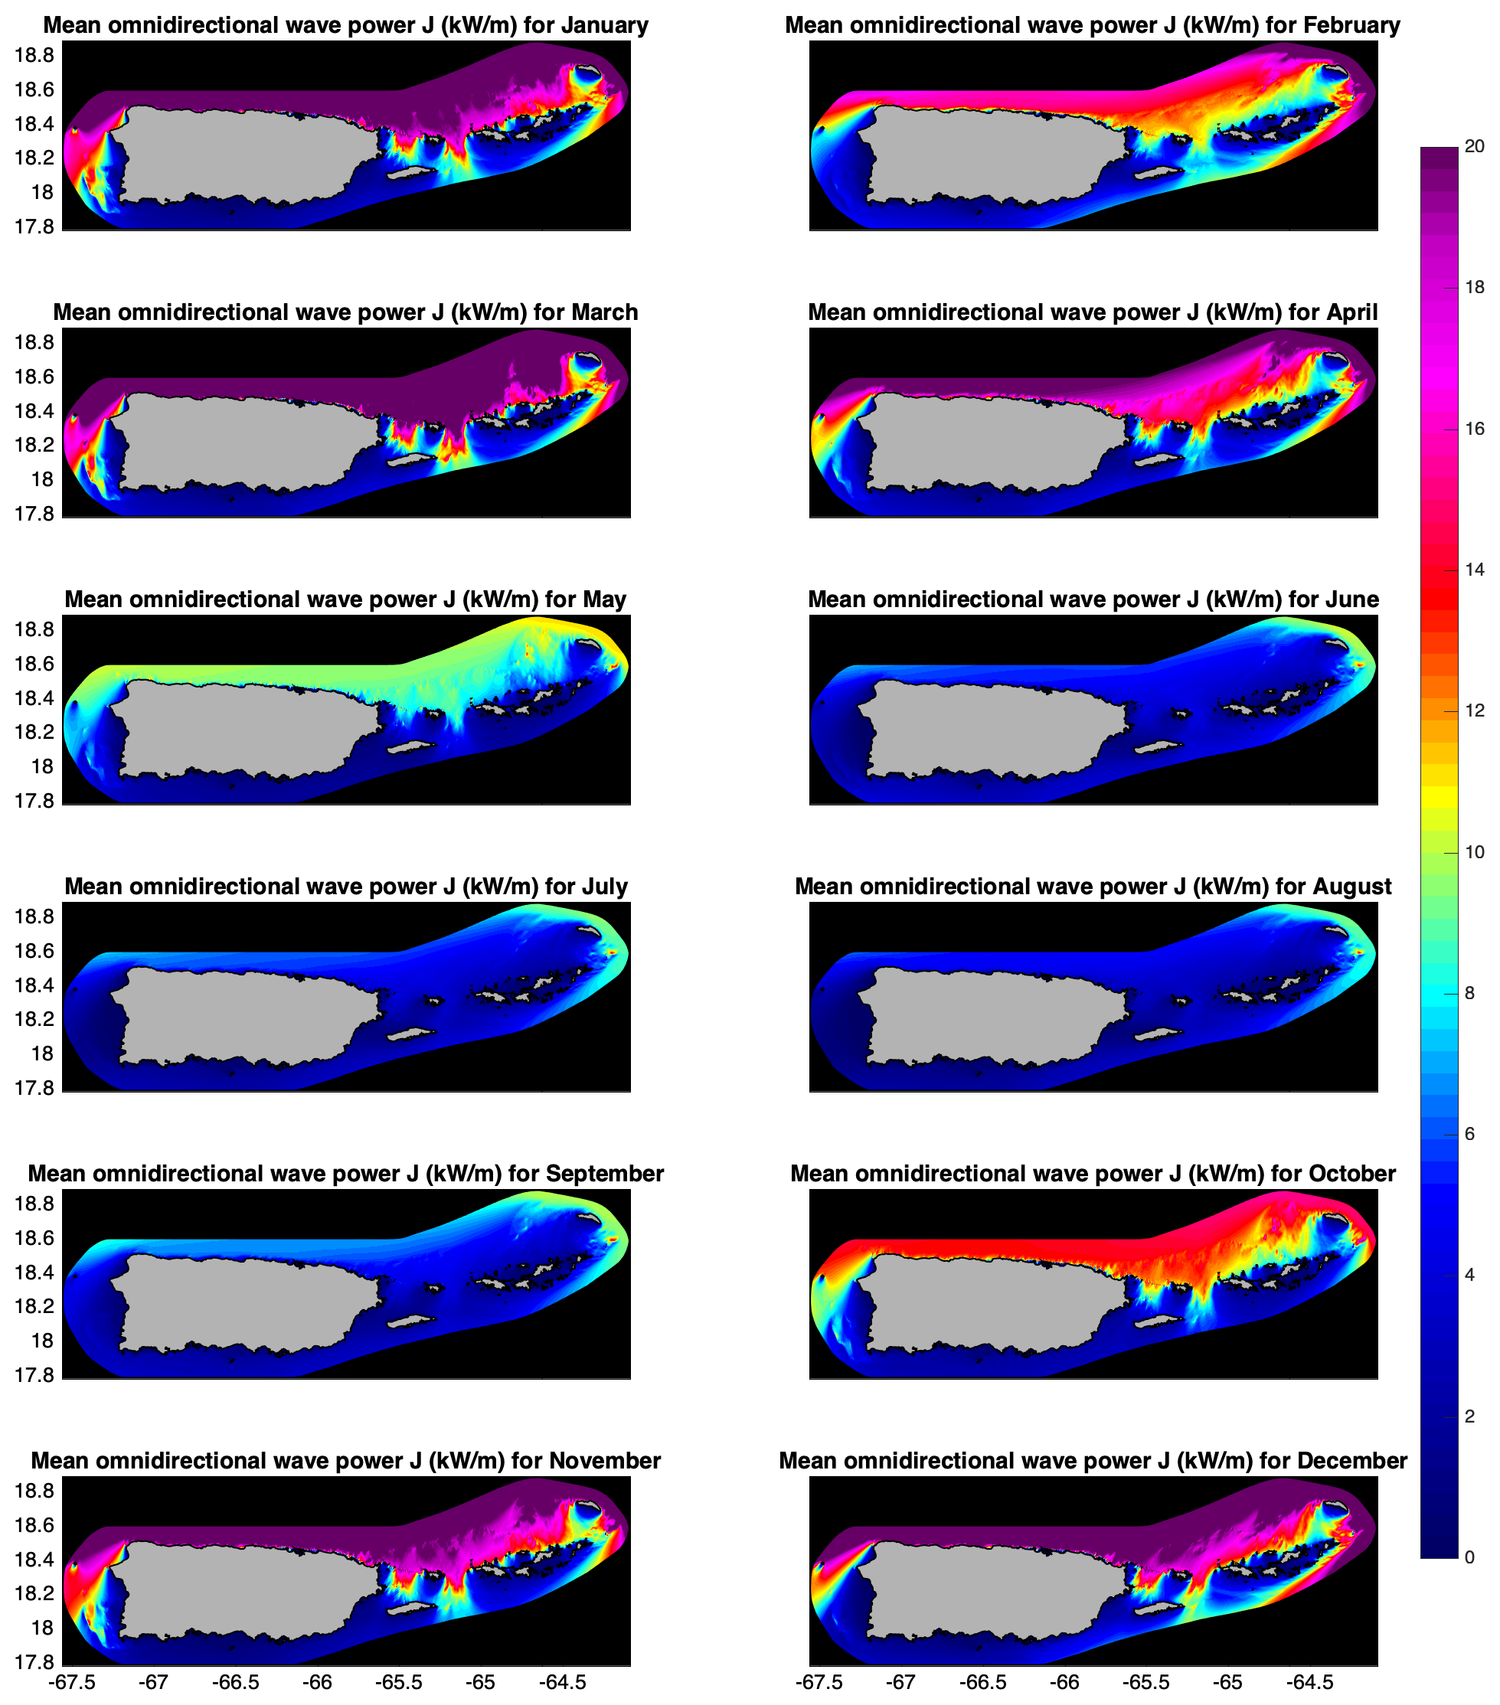
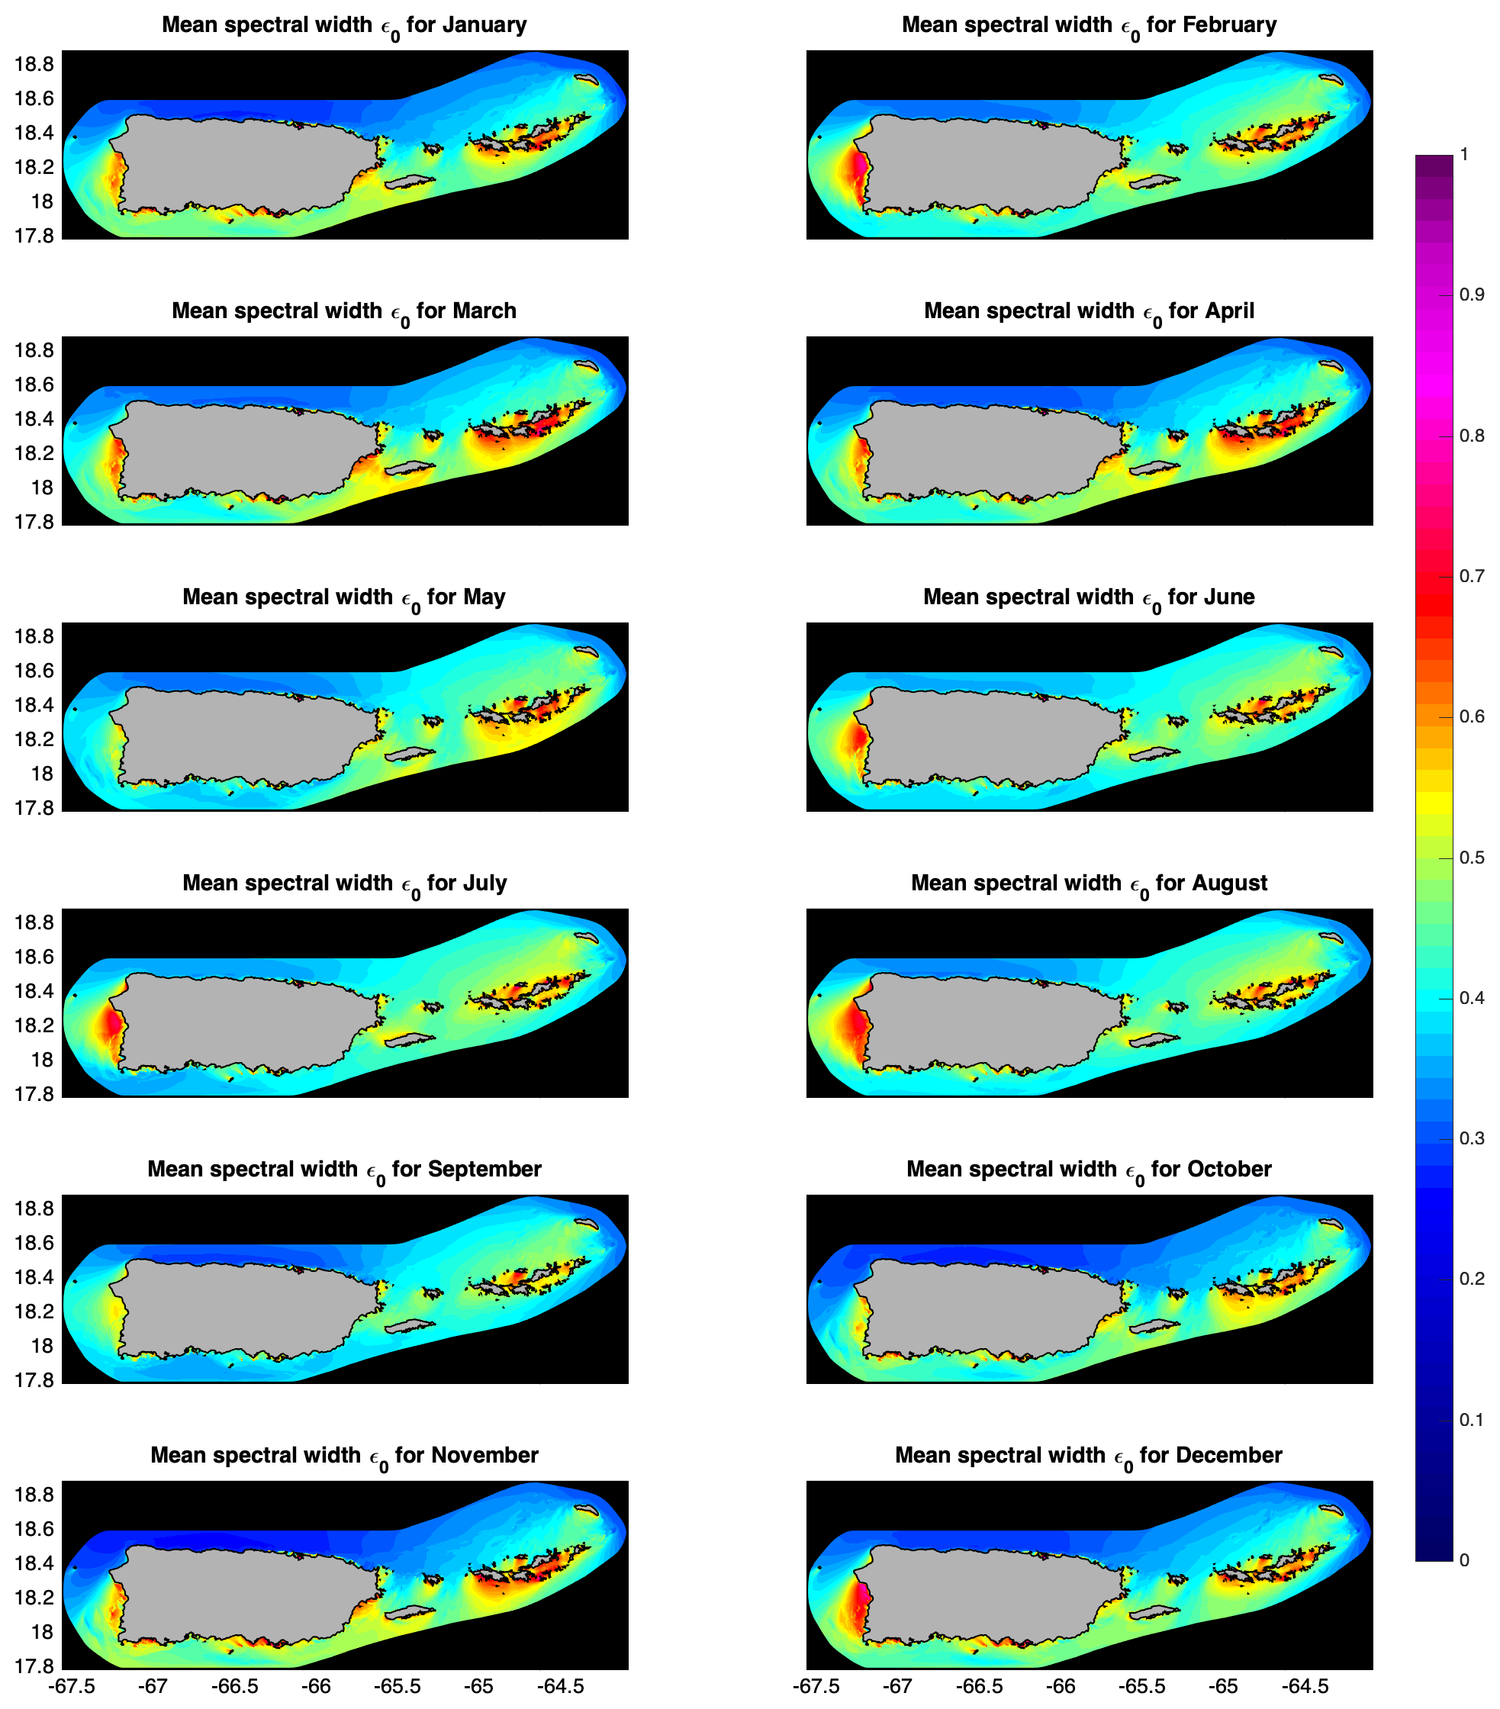
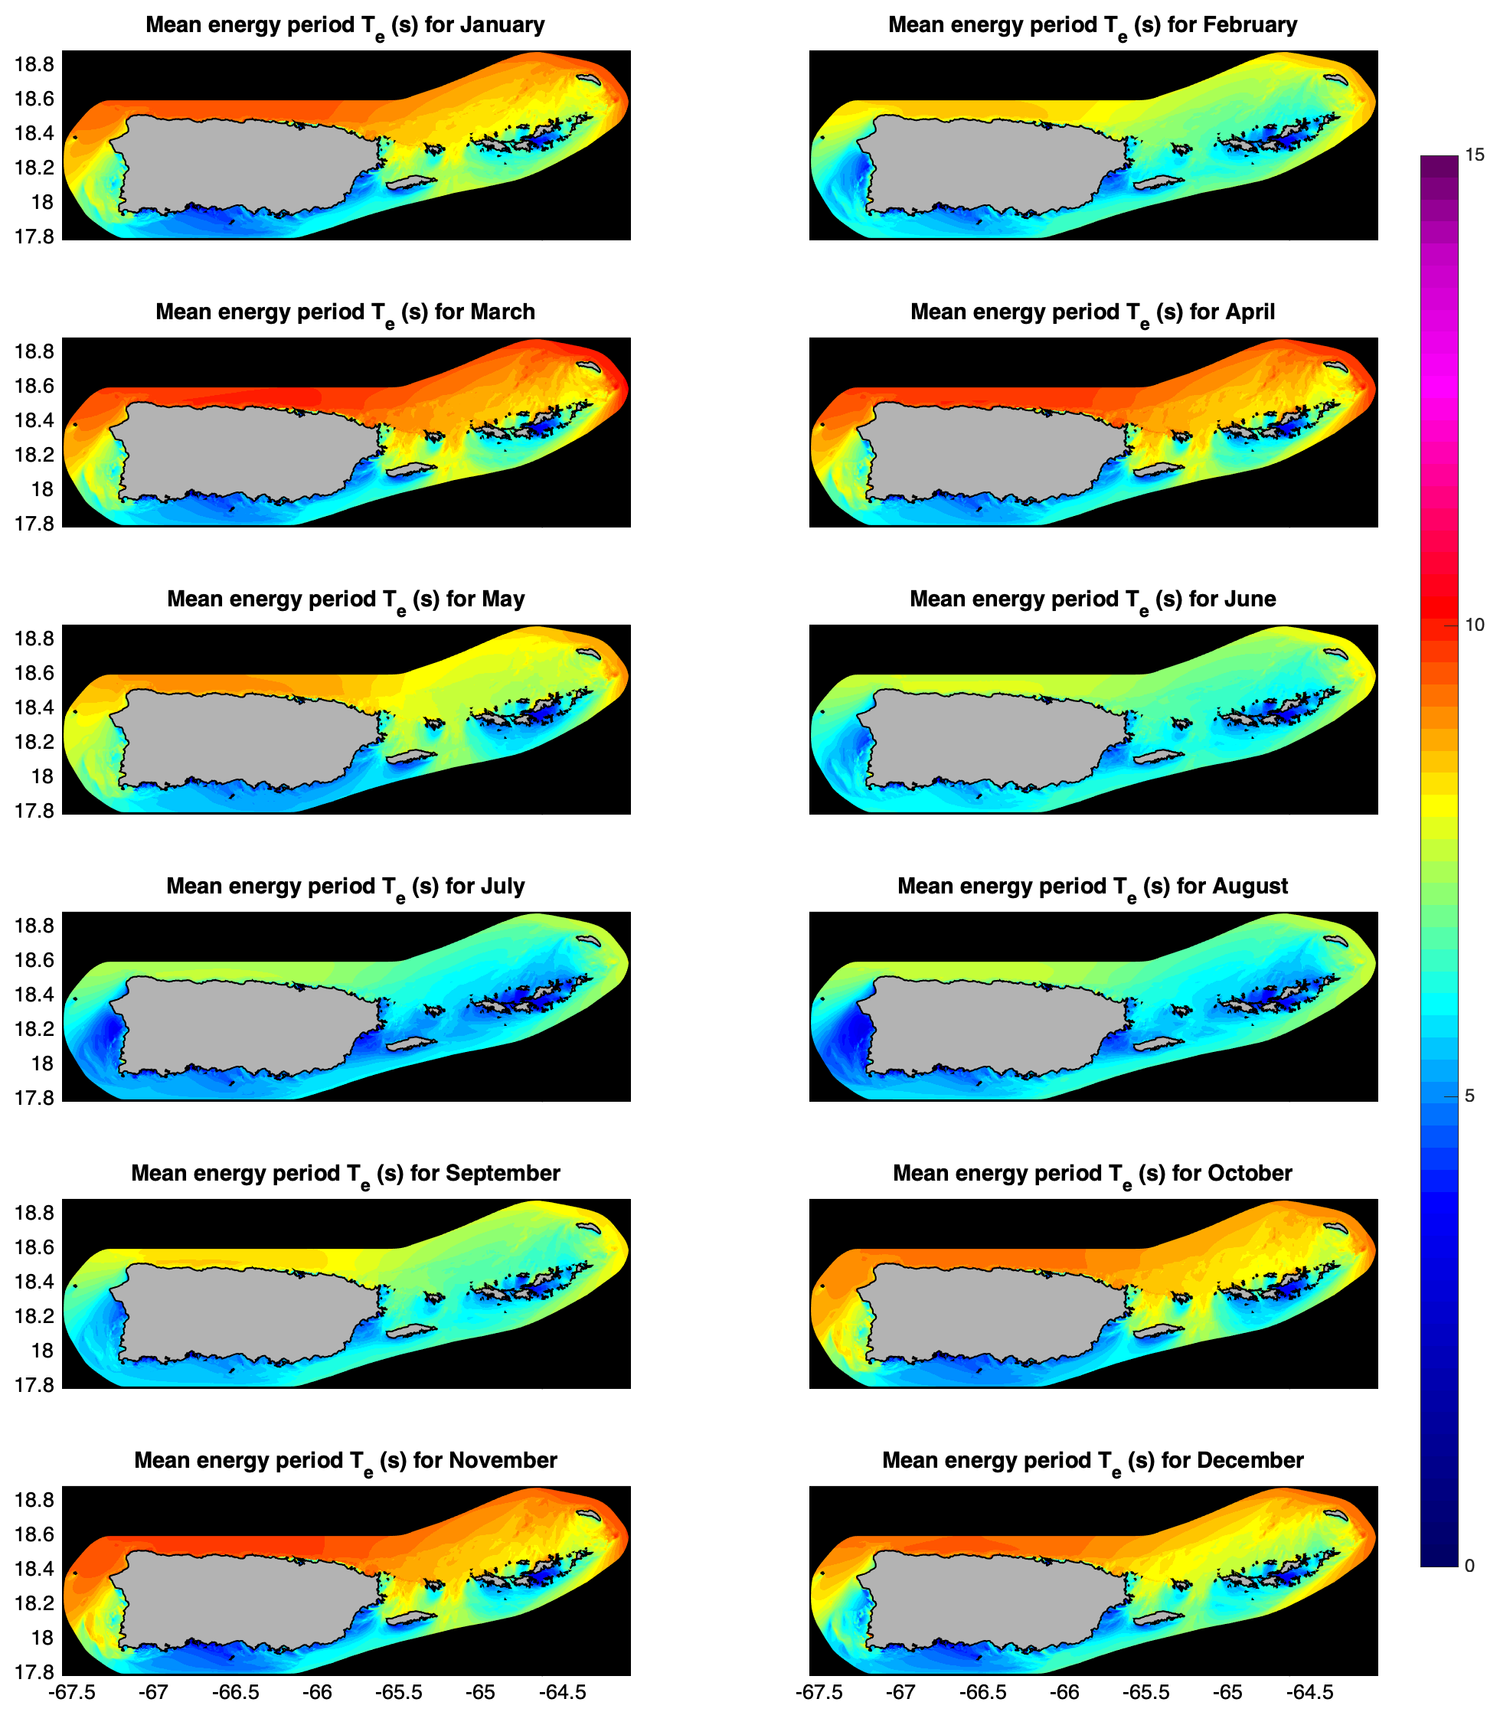
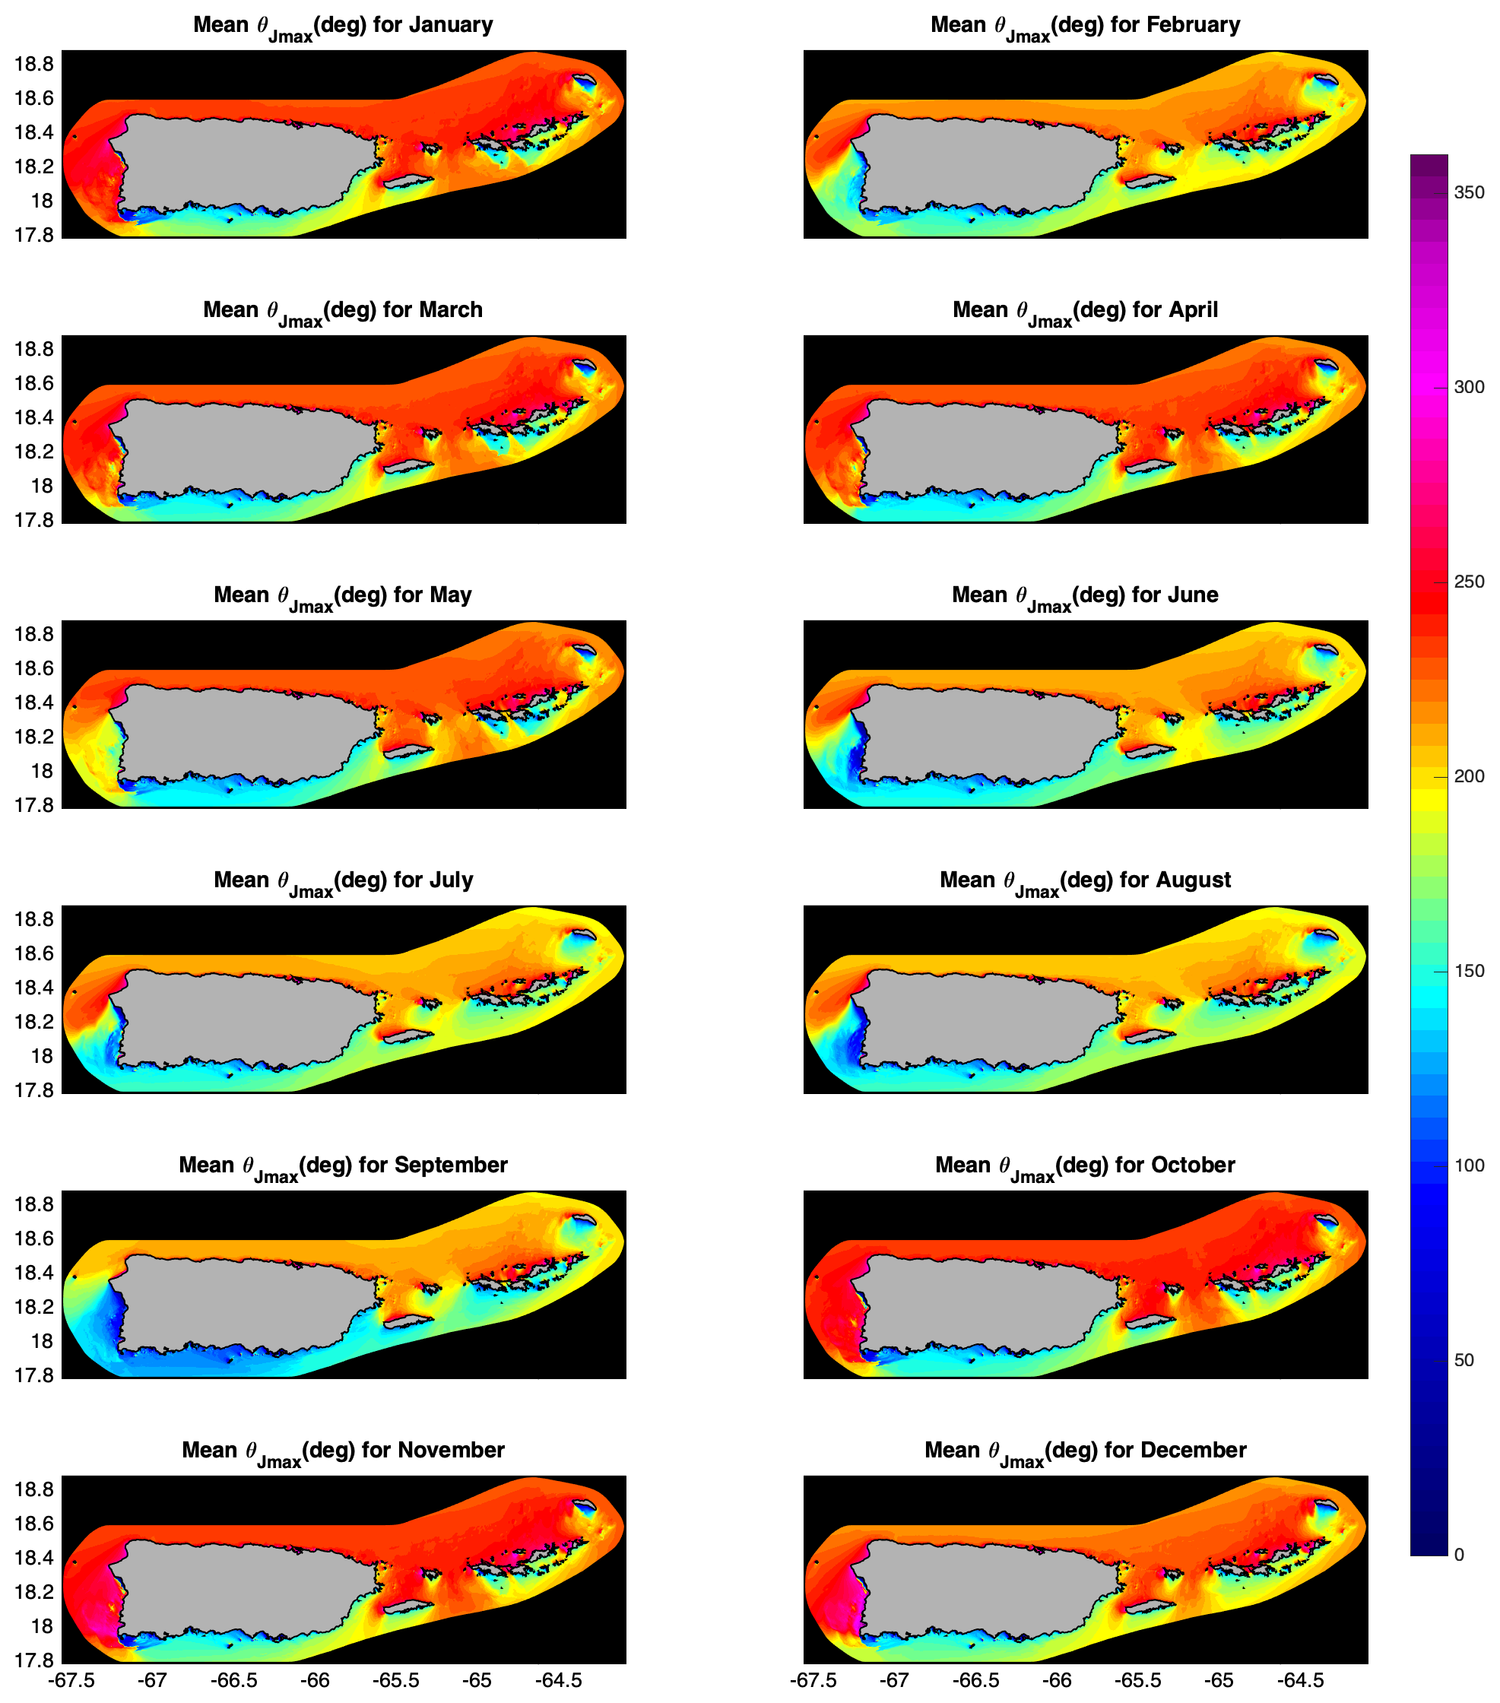
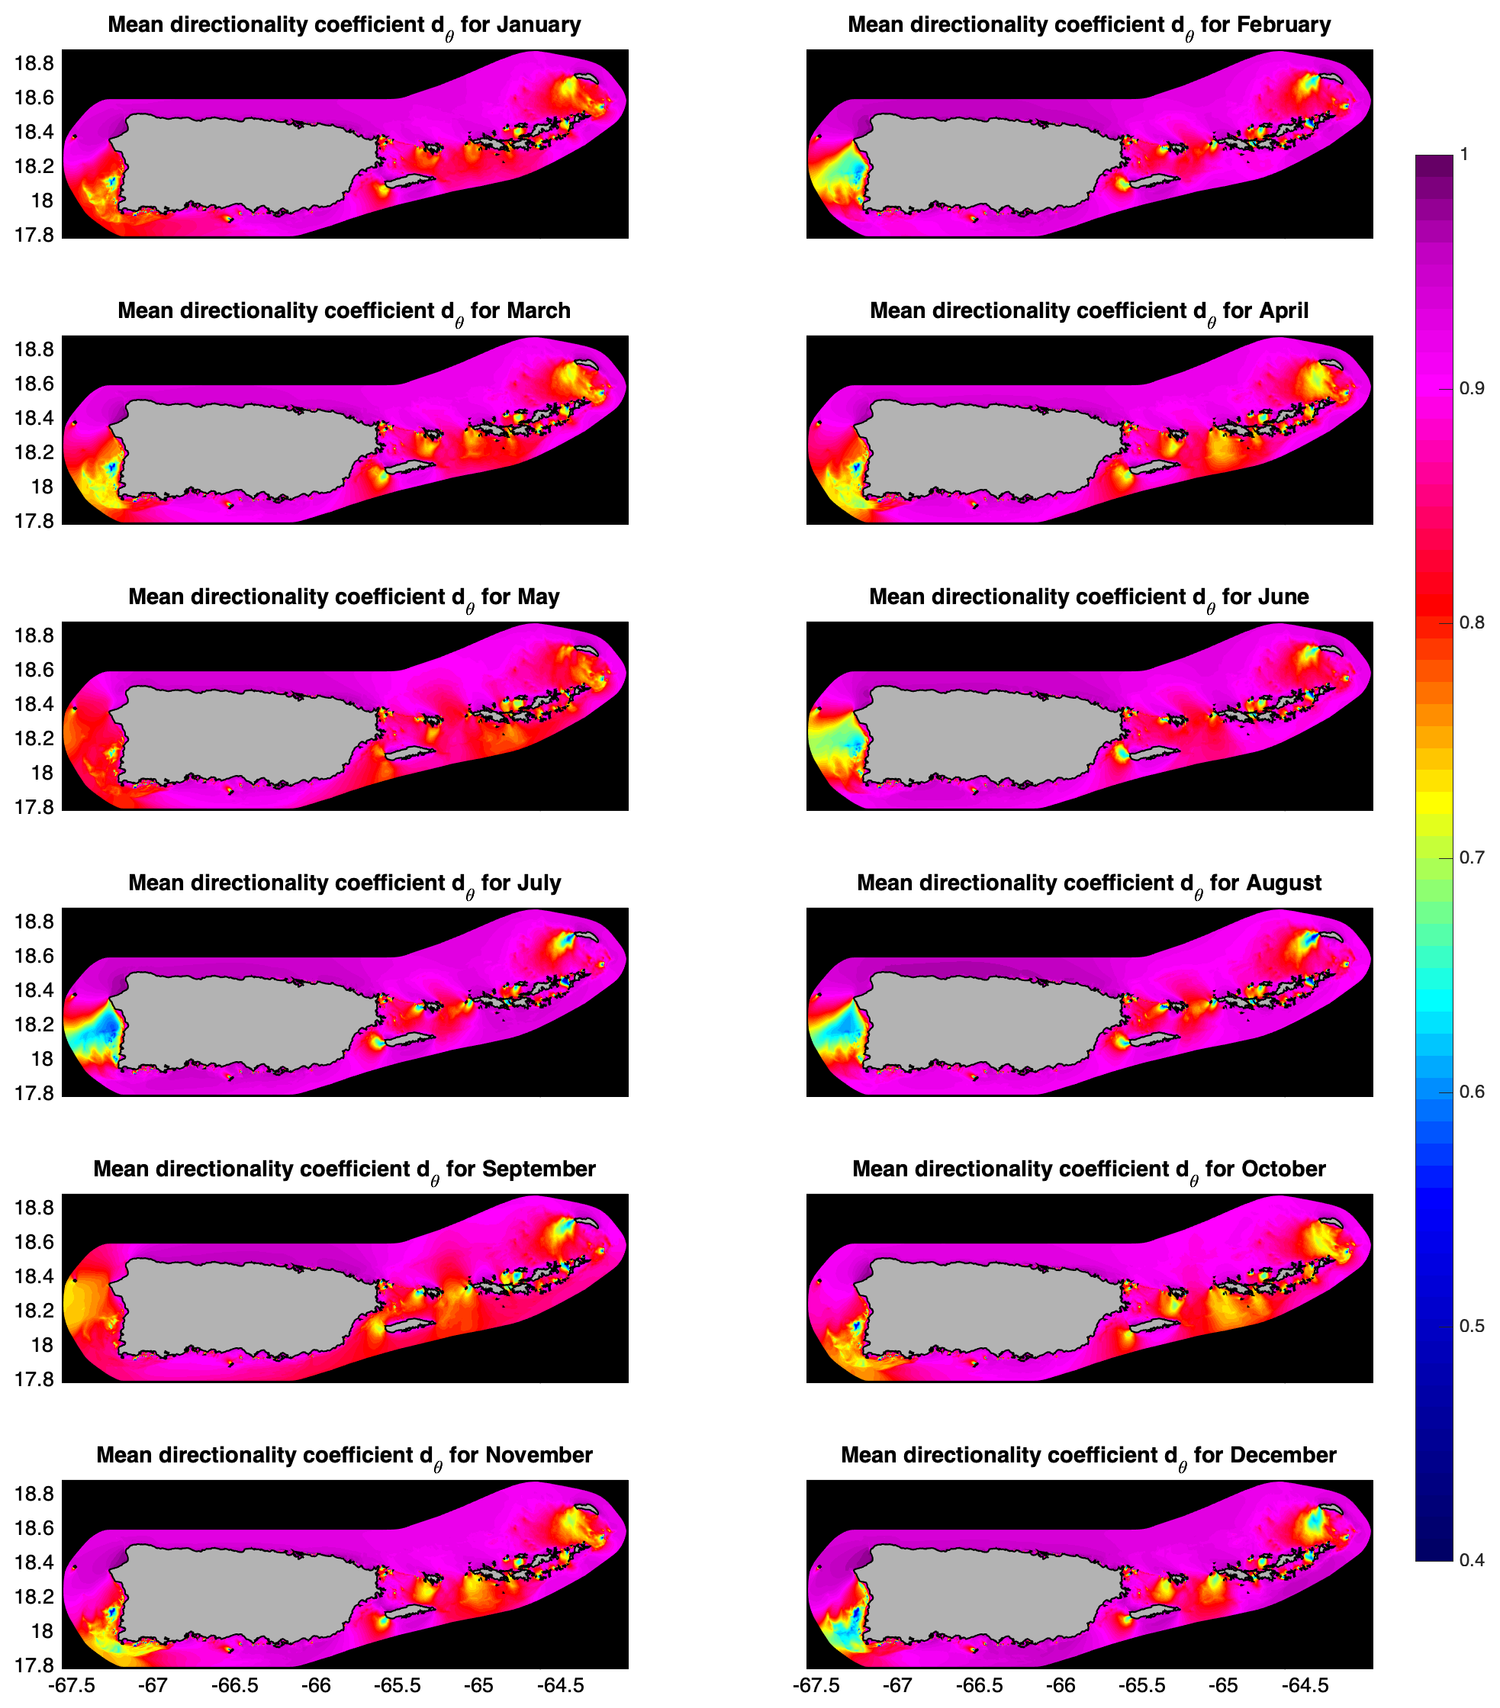
Besides the spatial variability in the annually averaged wave energy parameters, the temporal variability at, for example, monthly timescales, is very important as well for determining the feasibility of wave power generation projects. FThe figures below show the monthly-averaged wave power density (and all other five IEC parameters) for each month for the modeled period. Results show a well-defined annual cycle in wave power with strong seasonal variability, with largest wave power densities ocurring near north-facing areas and during the months between November and March. During these months, long-period winter swells caused by cold fronts and North Atlantic winter storms dominate the wave climate. Swell events typically last several days with peak significant wave heights ranging from 2-6 meters and peak periods from 10-20 seconds. The dominant direction for these events is from the northwest, north or northeast.For custom products or for maps of specific regions please contact the Principal Investigator Miguel F Canals Silander via email: miguelf.canals@upr.edu.


