In order to visualize the spatial and temporal distribution of the ocean current energy and OTEC resource, as part of the ocean energy atlas development we have produced very high-resolution maps of the following quantities / products:
Maps of the mean ocean surface current magnitude and direction for the PR/USVI region for calendar year 2019.
Maps of the mean instantaneous ocean current power density P for the PR/USVI region for calendar year 2019.
Maps of the mean temperature difference between the sea surface and 1 km depth for the PR/USVI region for calendar year 2019.
For custom products or for maps of specific regions please contact the Principal Investigator Miguel F Canals Silander via email: miguelf.canals@upr.edu.
MAP PRODUCTS FOR PUERTO RICO / USVI REGION
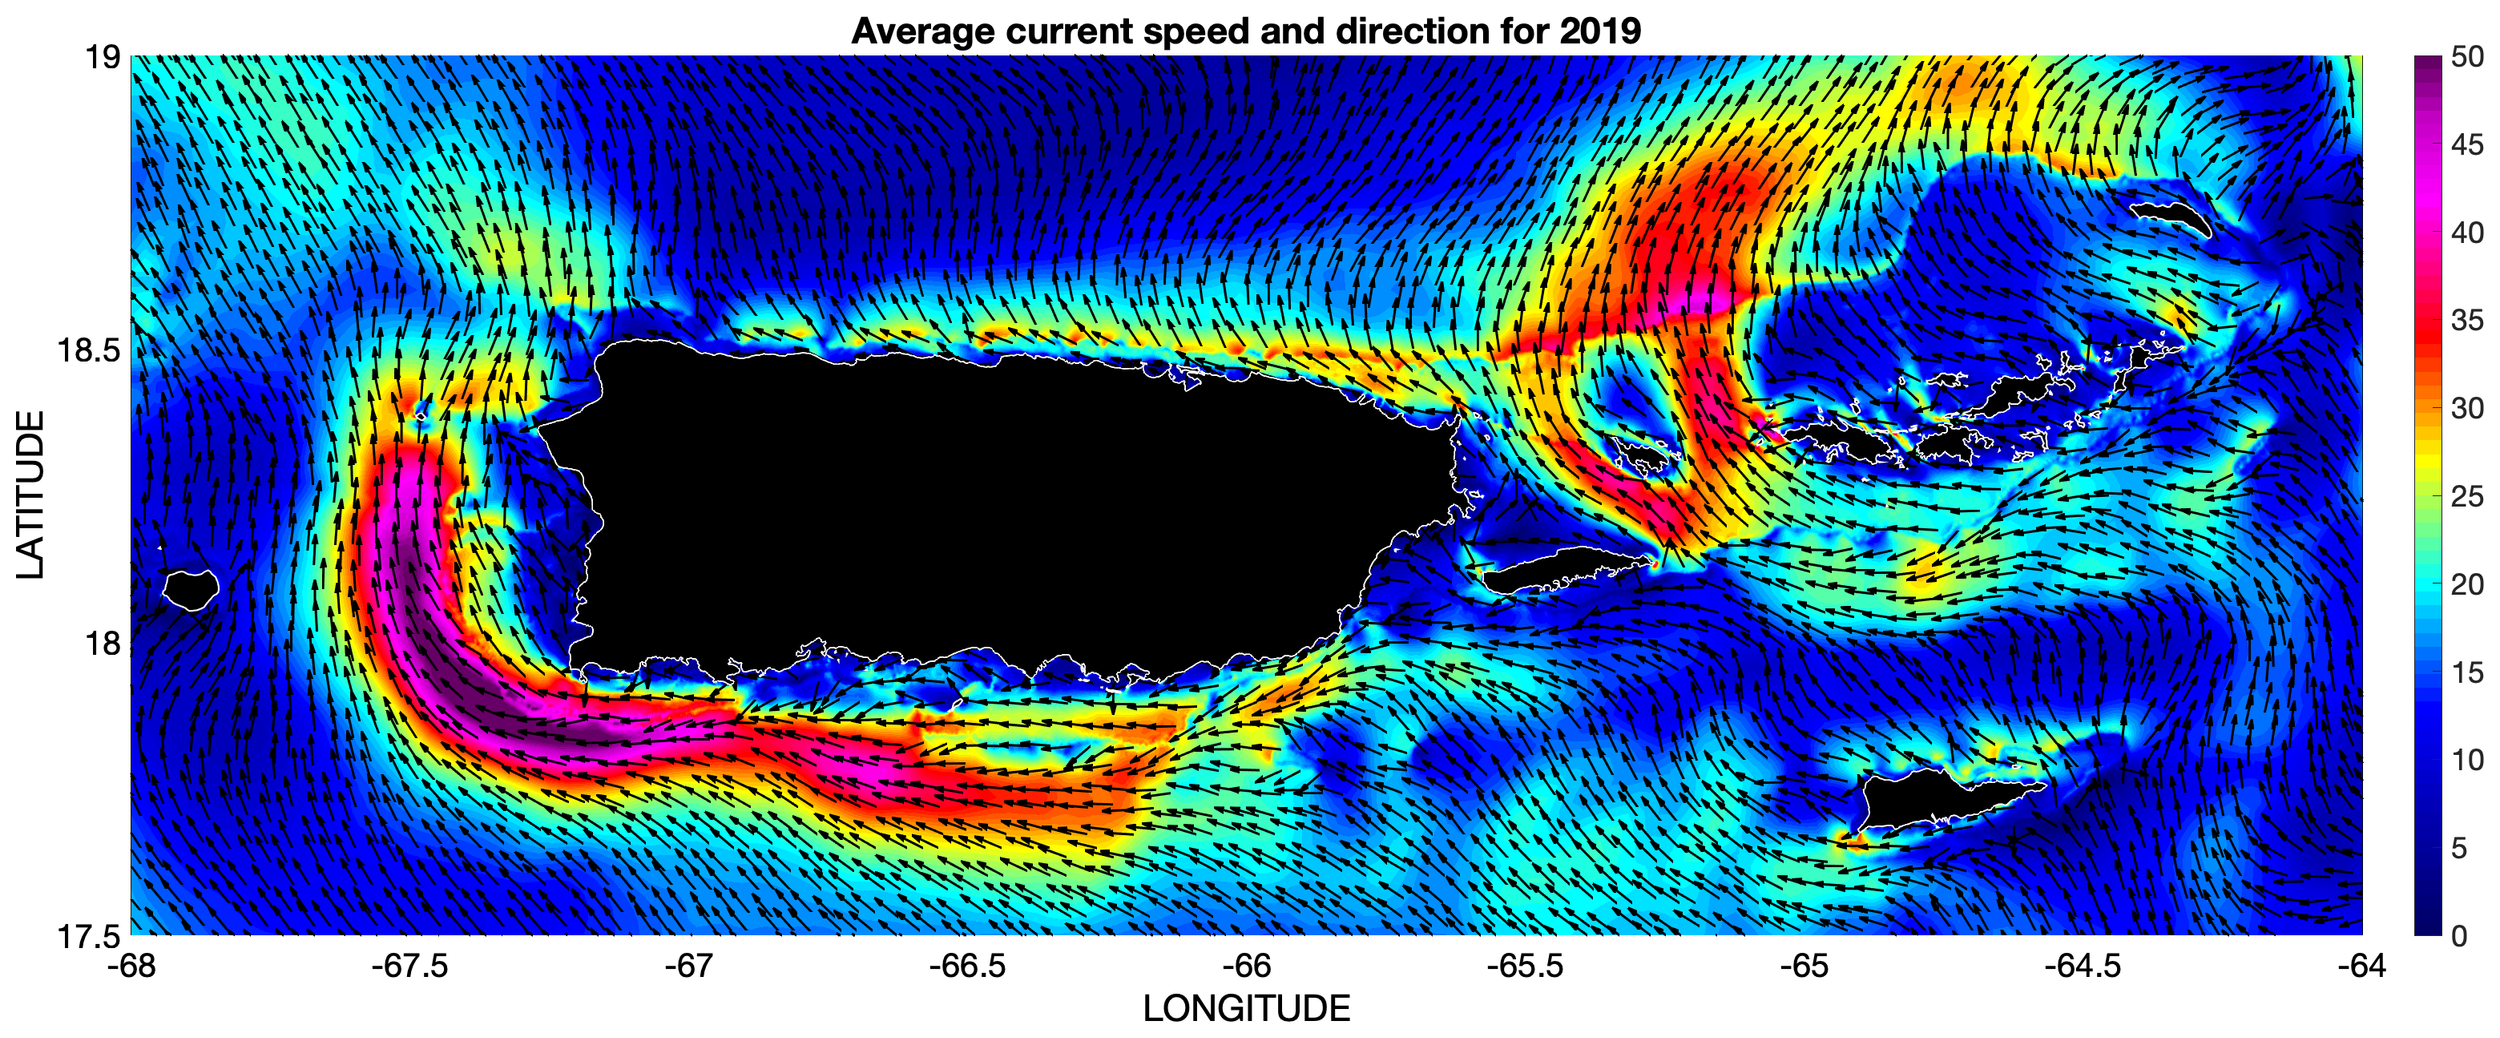 Mean simulated ocean surface current magnitude and direction for the PR/USVI region for 2019.
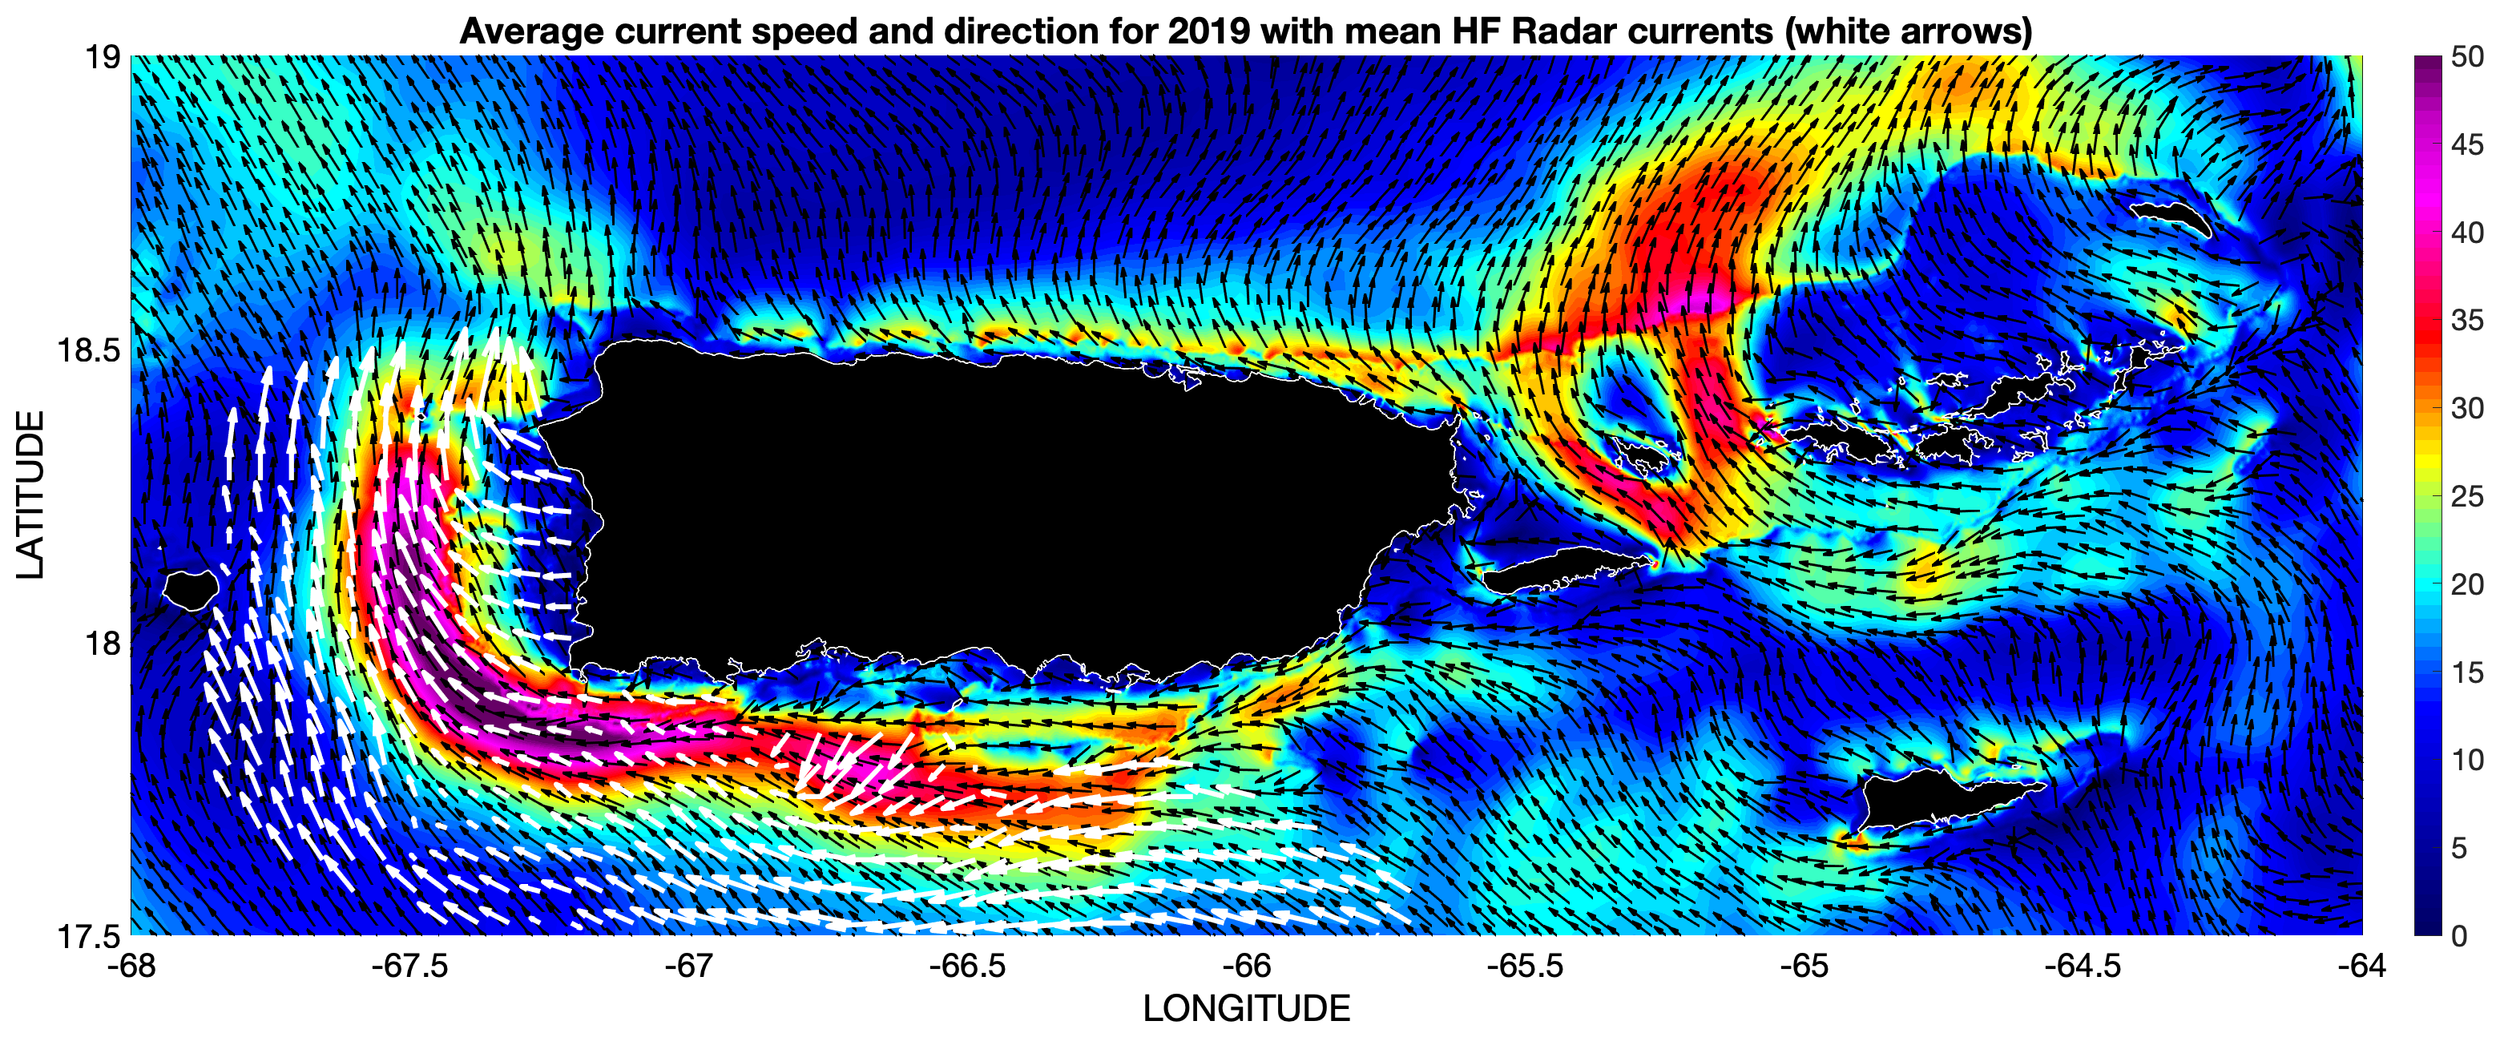 Mean current magnitude and direction for the PR/USVI region for 2019, with HFR overlay.
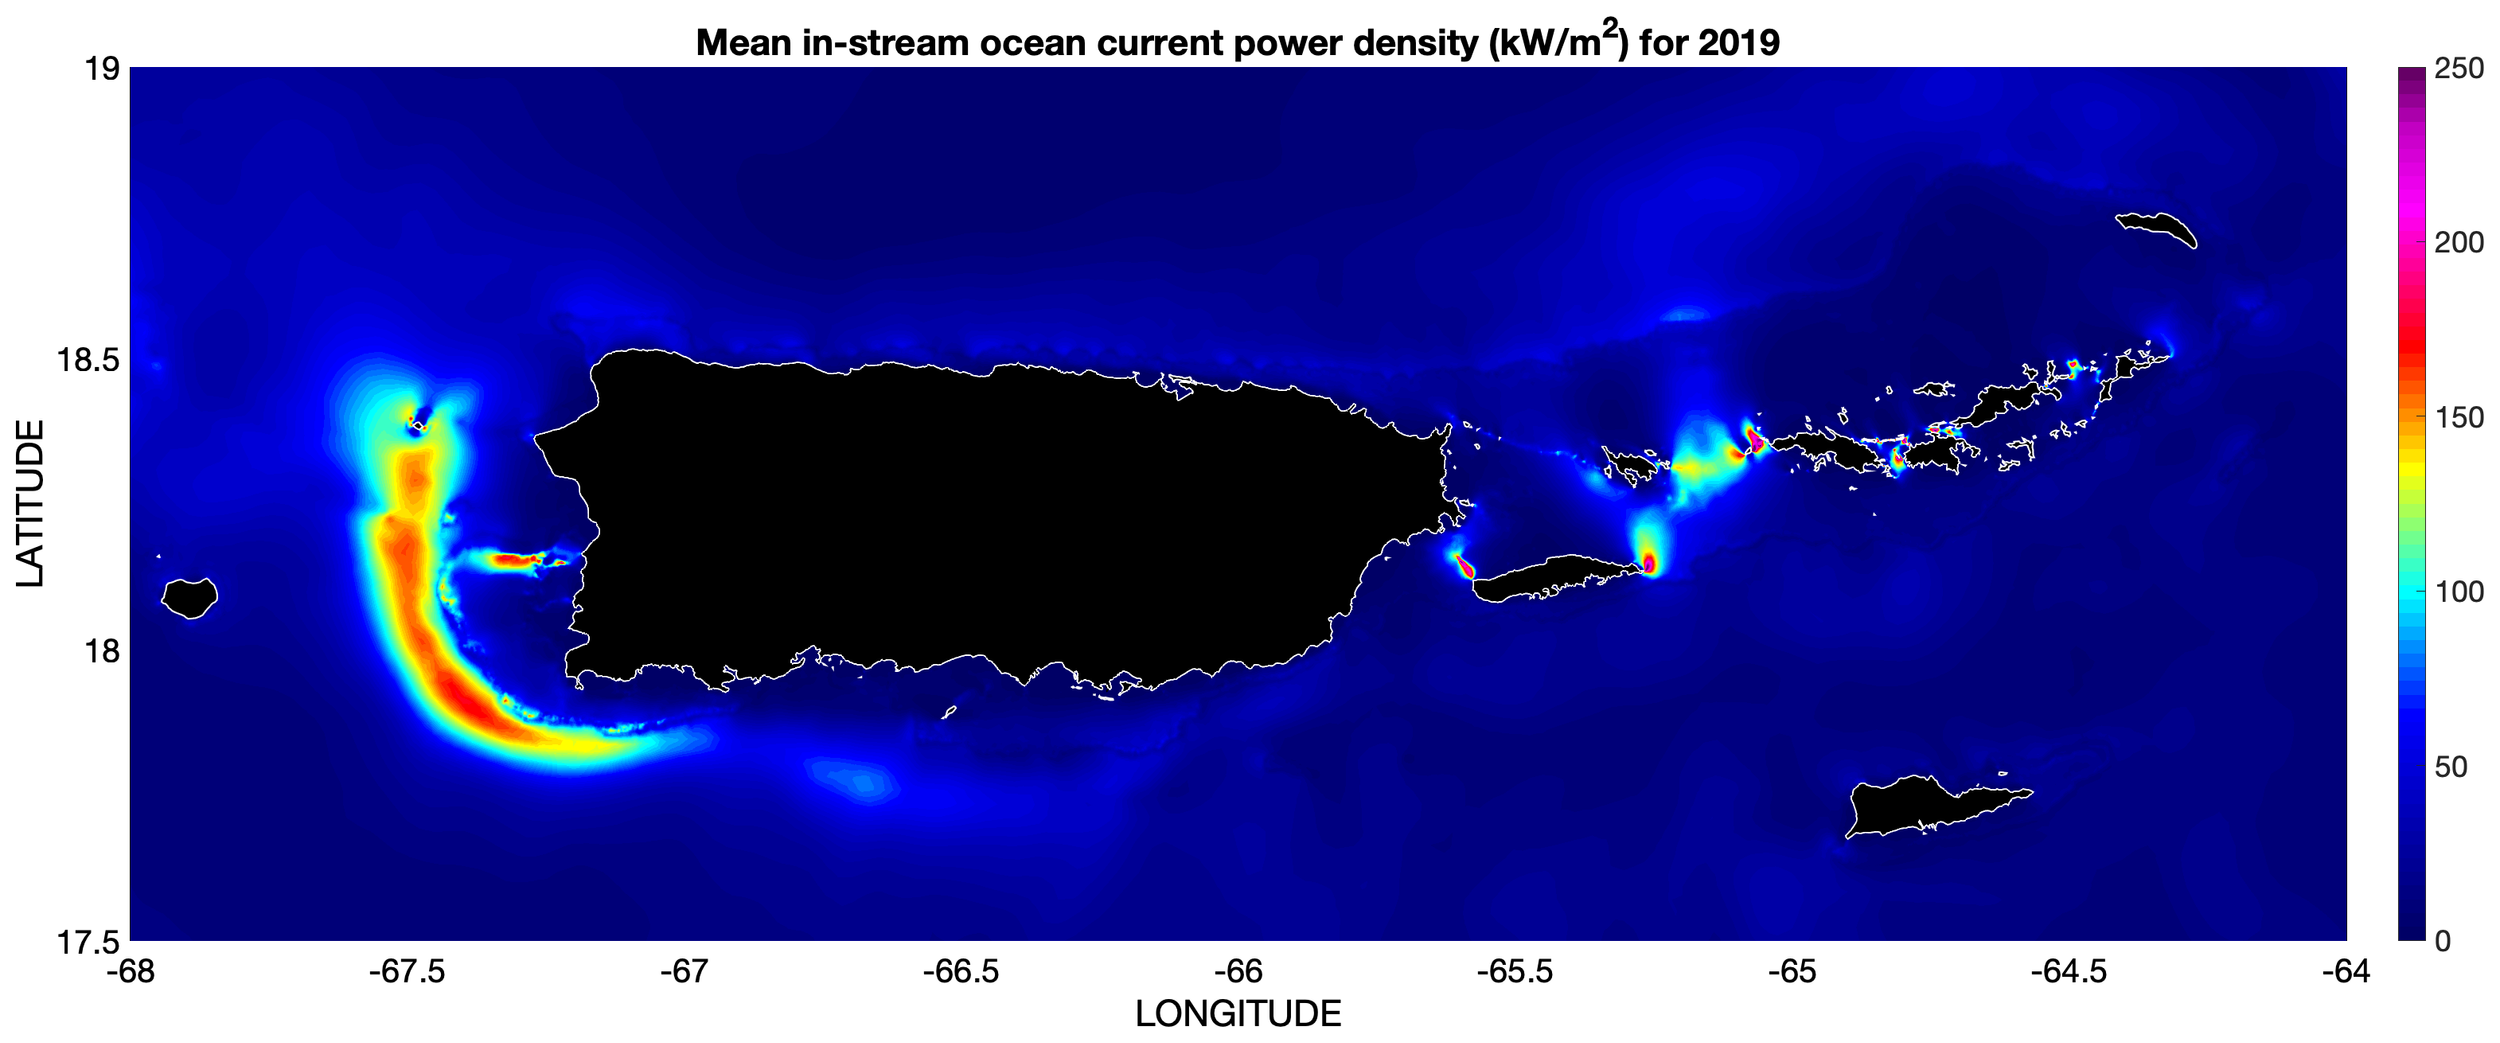 Map of mean in-stream ocean current power for 2019.
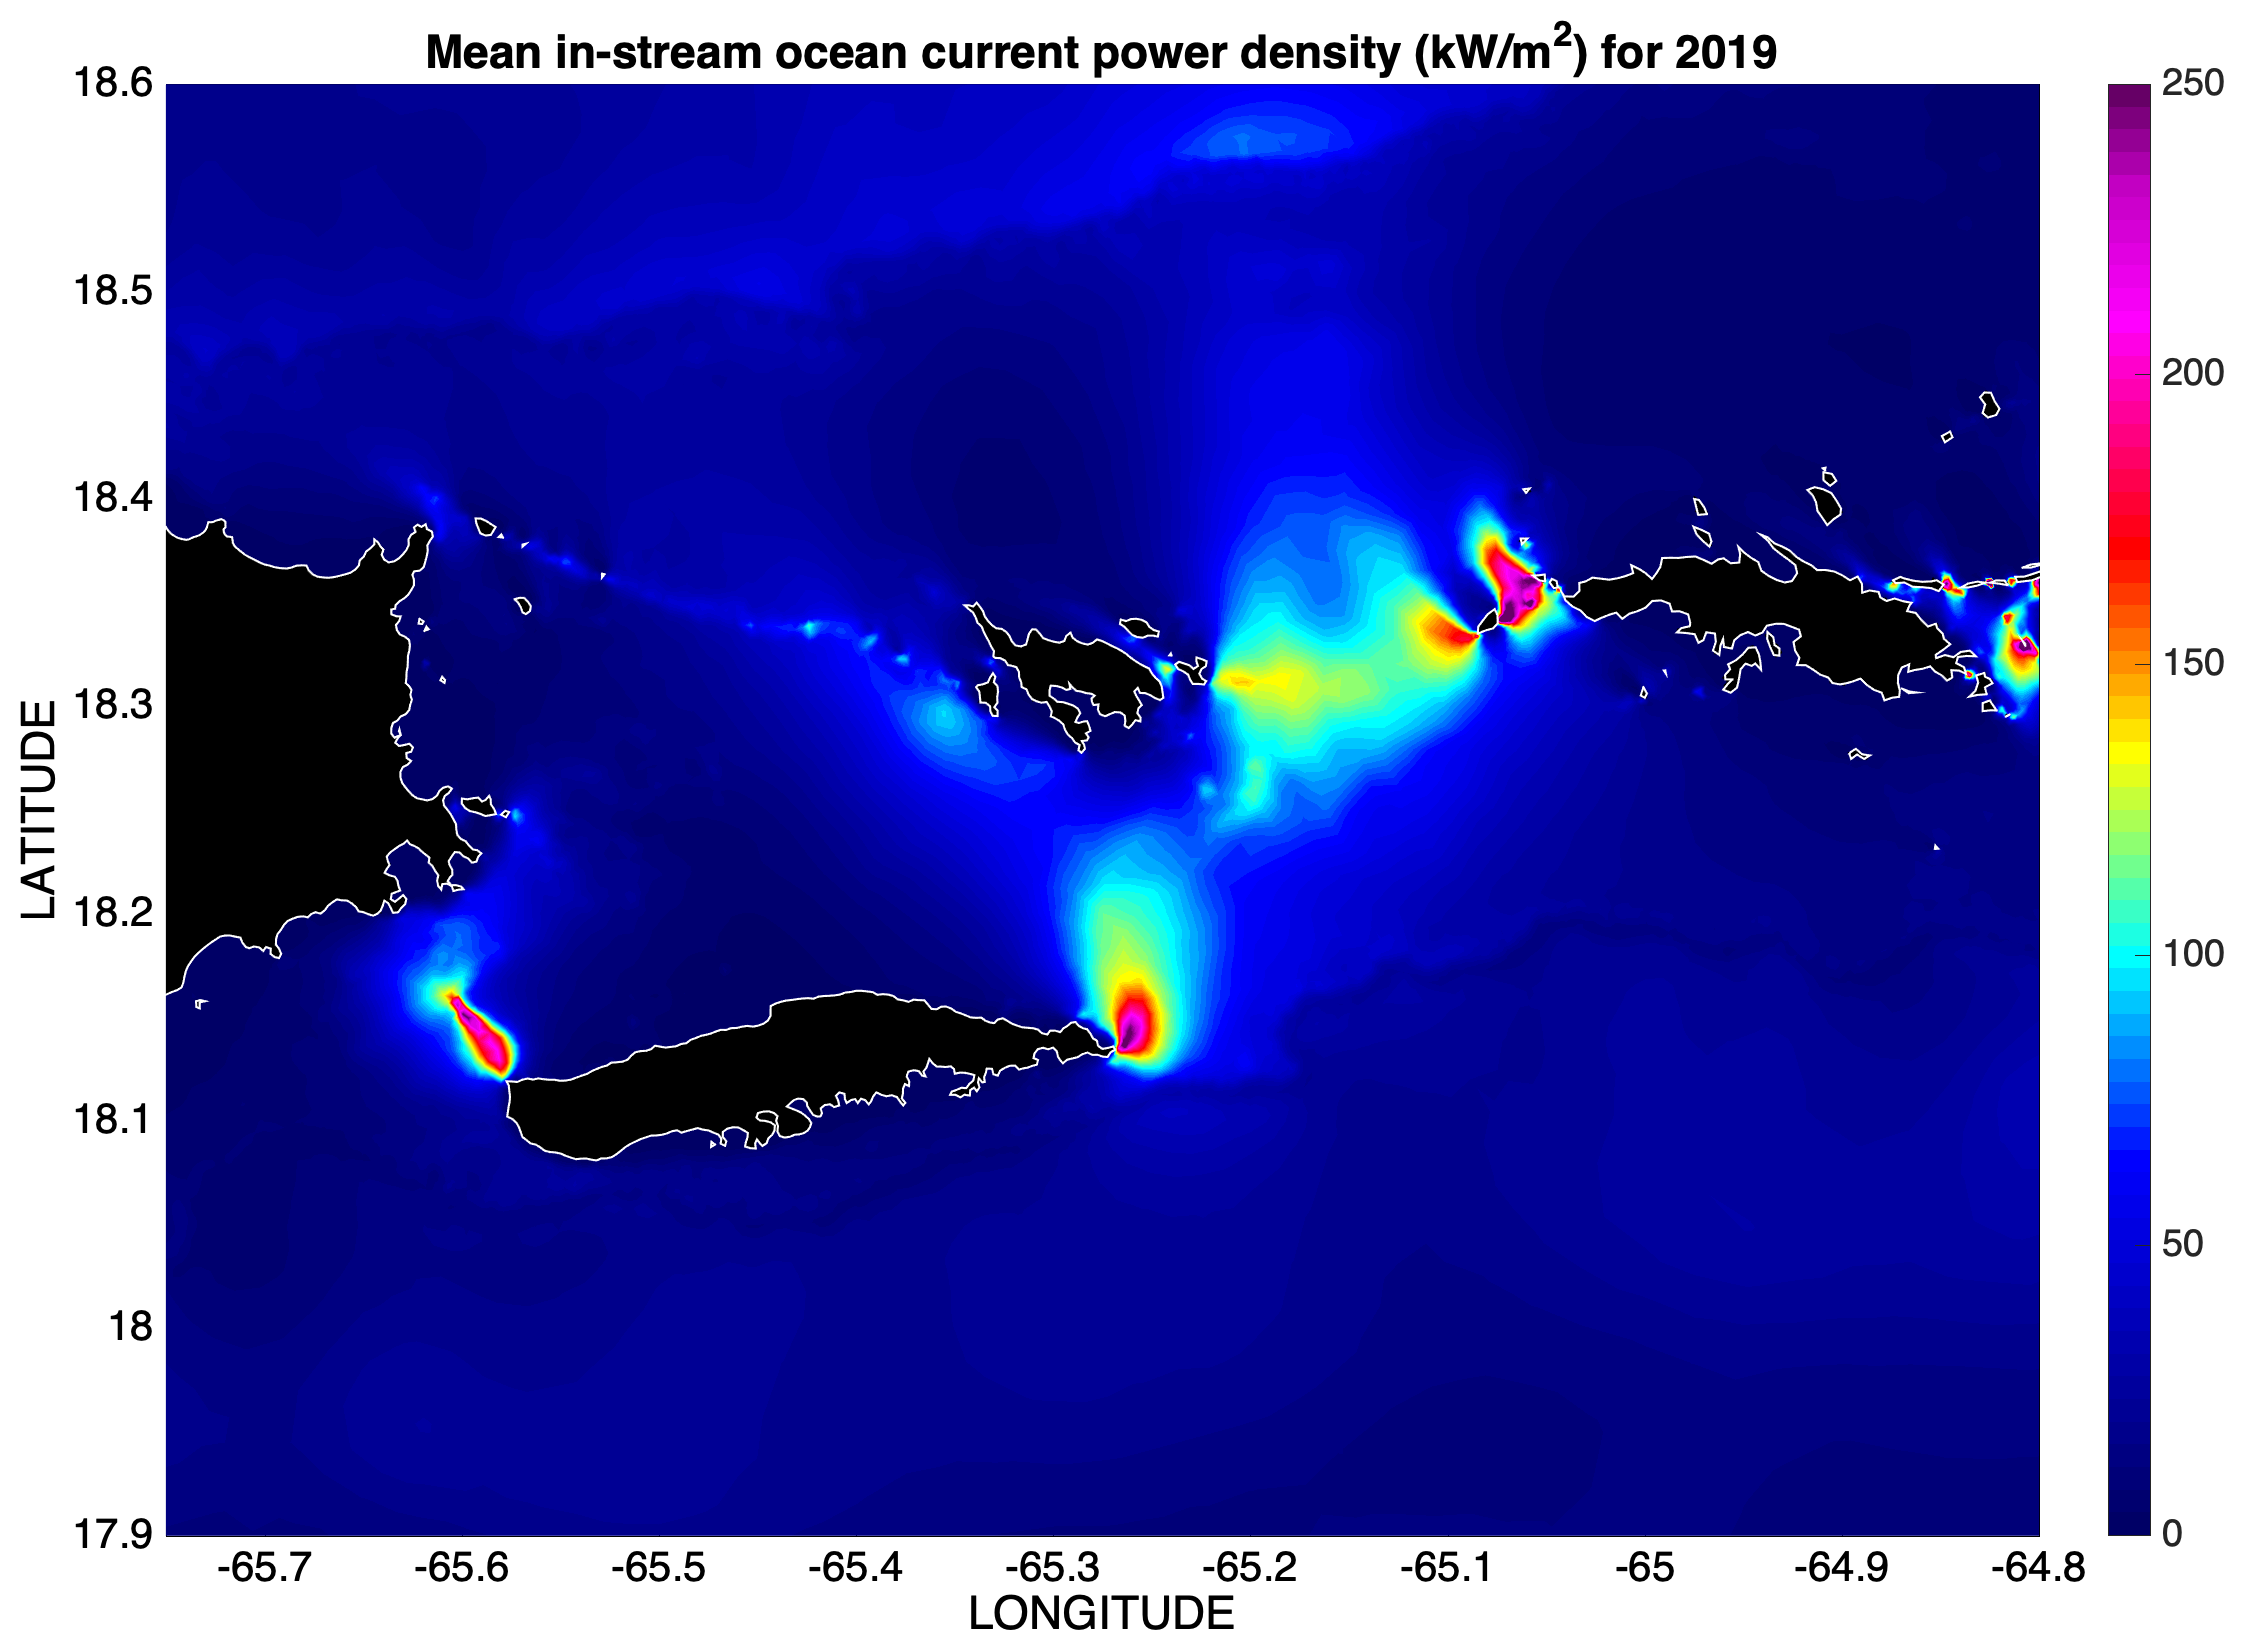 Map of the mean instantaneous ocean current power density P for eastern PR for calendar year 2019.
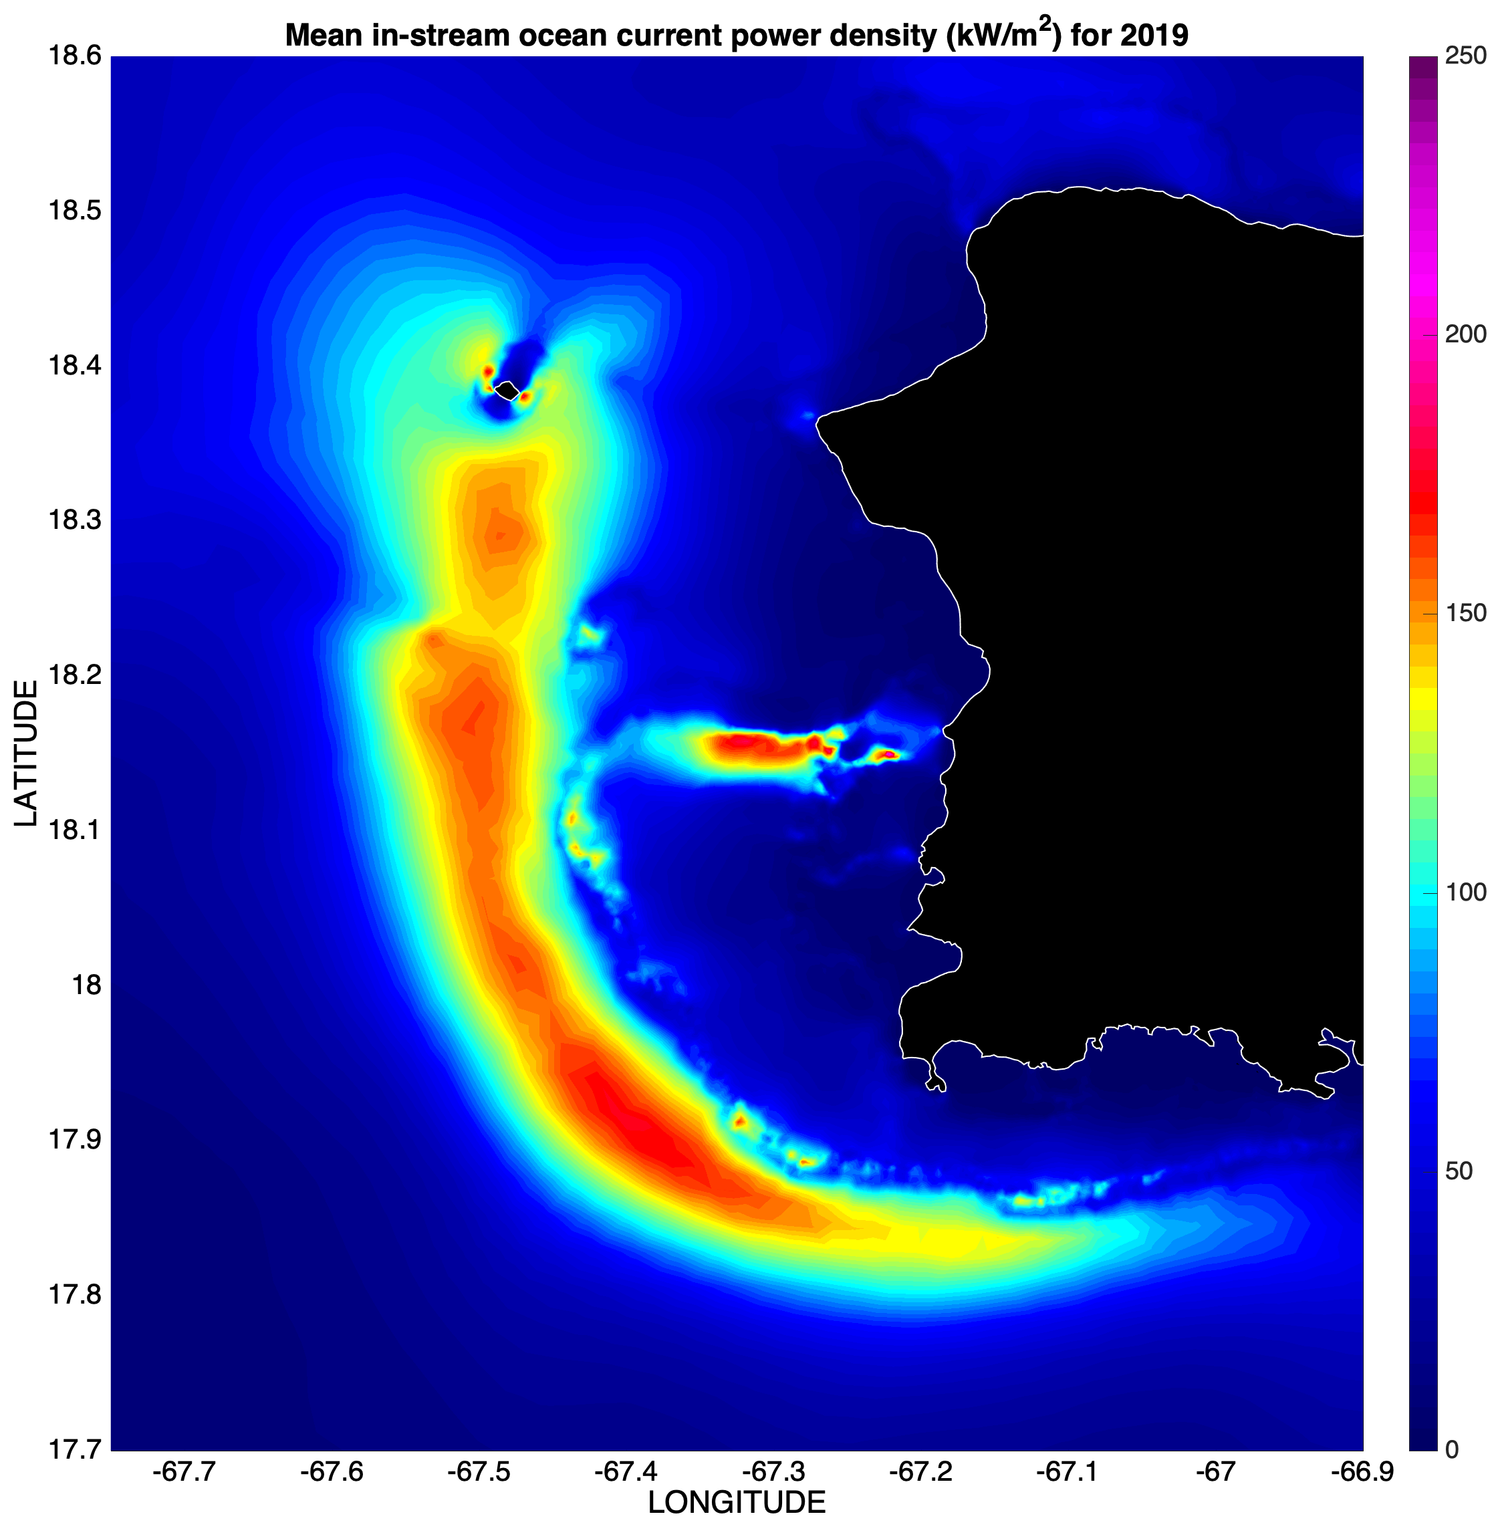 Map of the mean instantaneous ocean current power density P for the western PR for calendar year 2019.
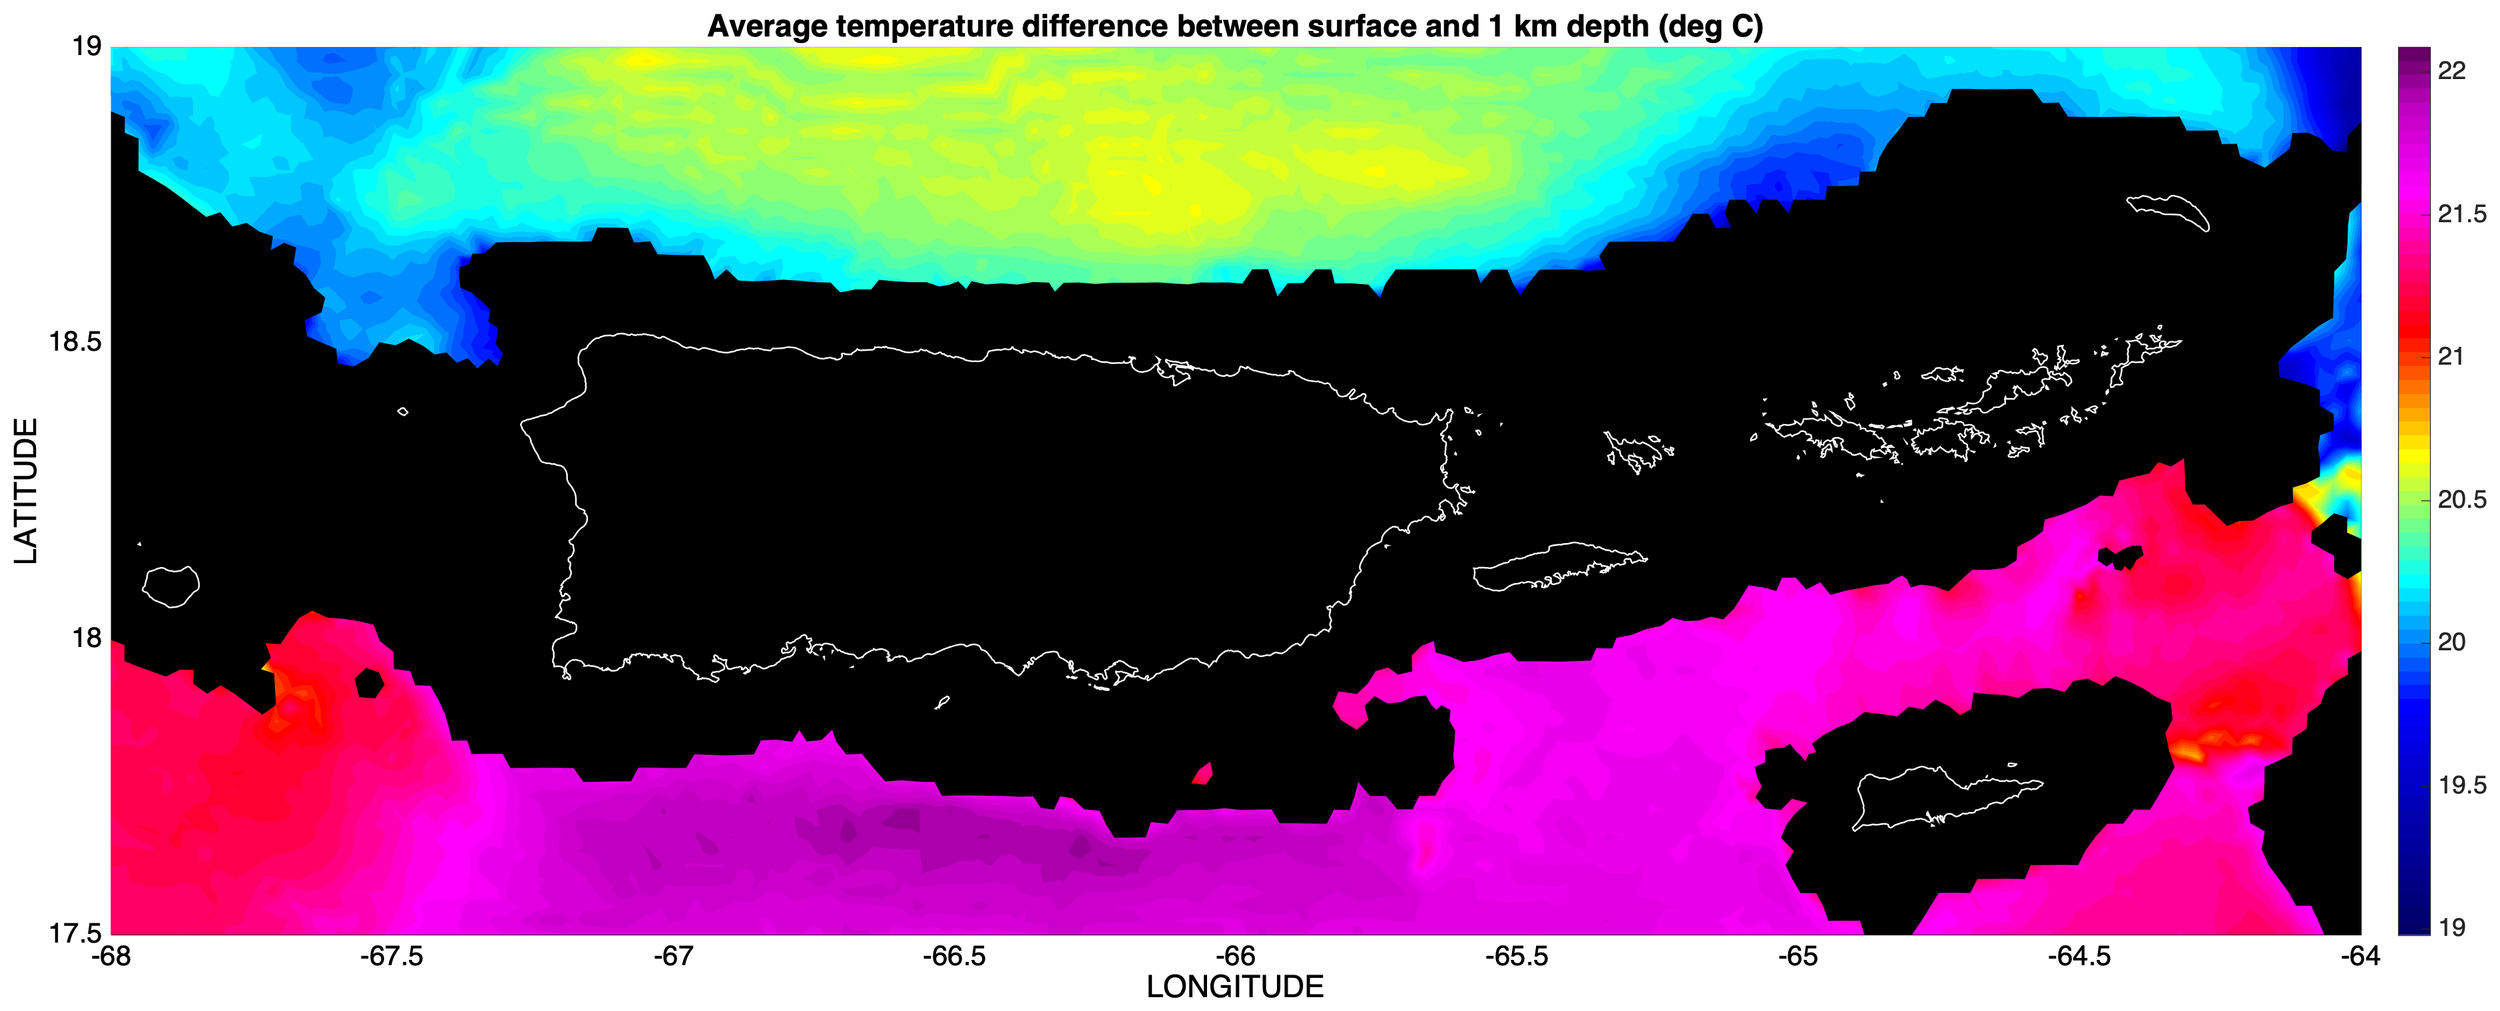 Map of the mean temperature difference between the sea surface and 1 km depth for the PR/USVI region for calendar year 2019.