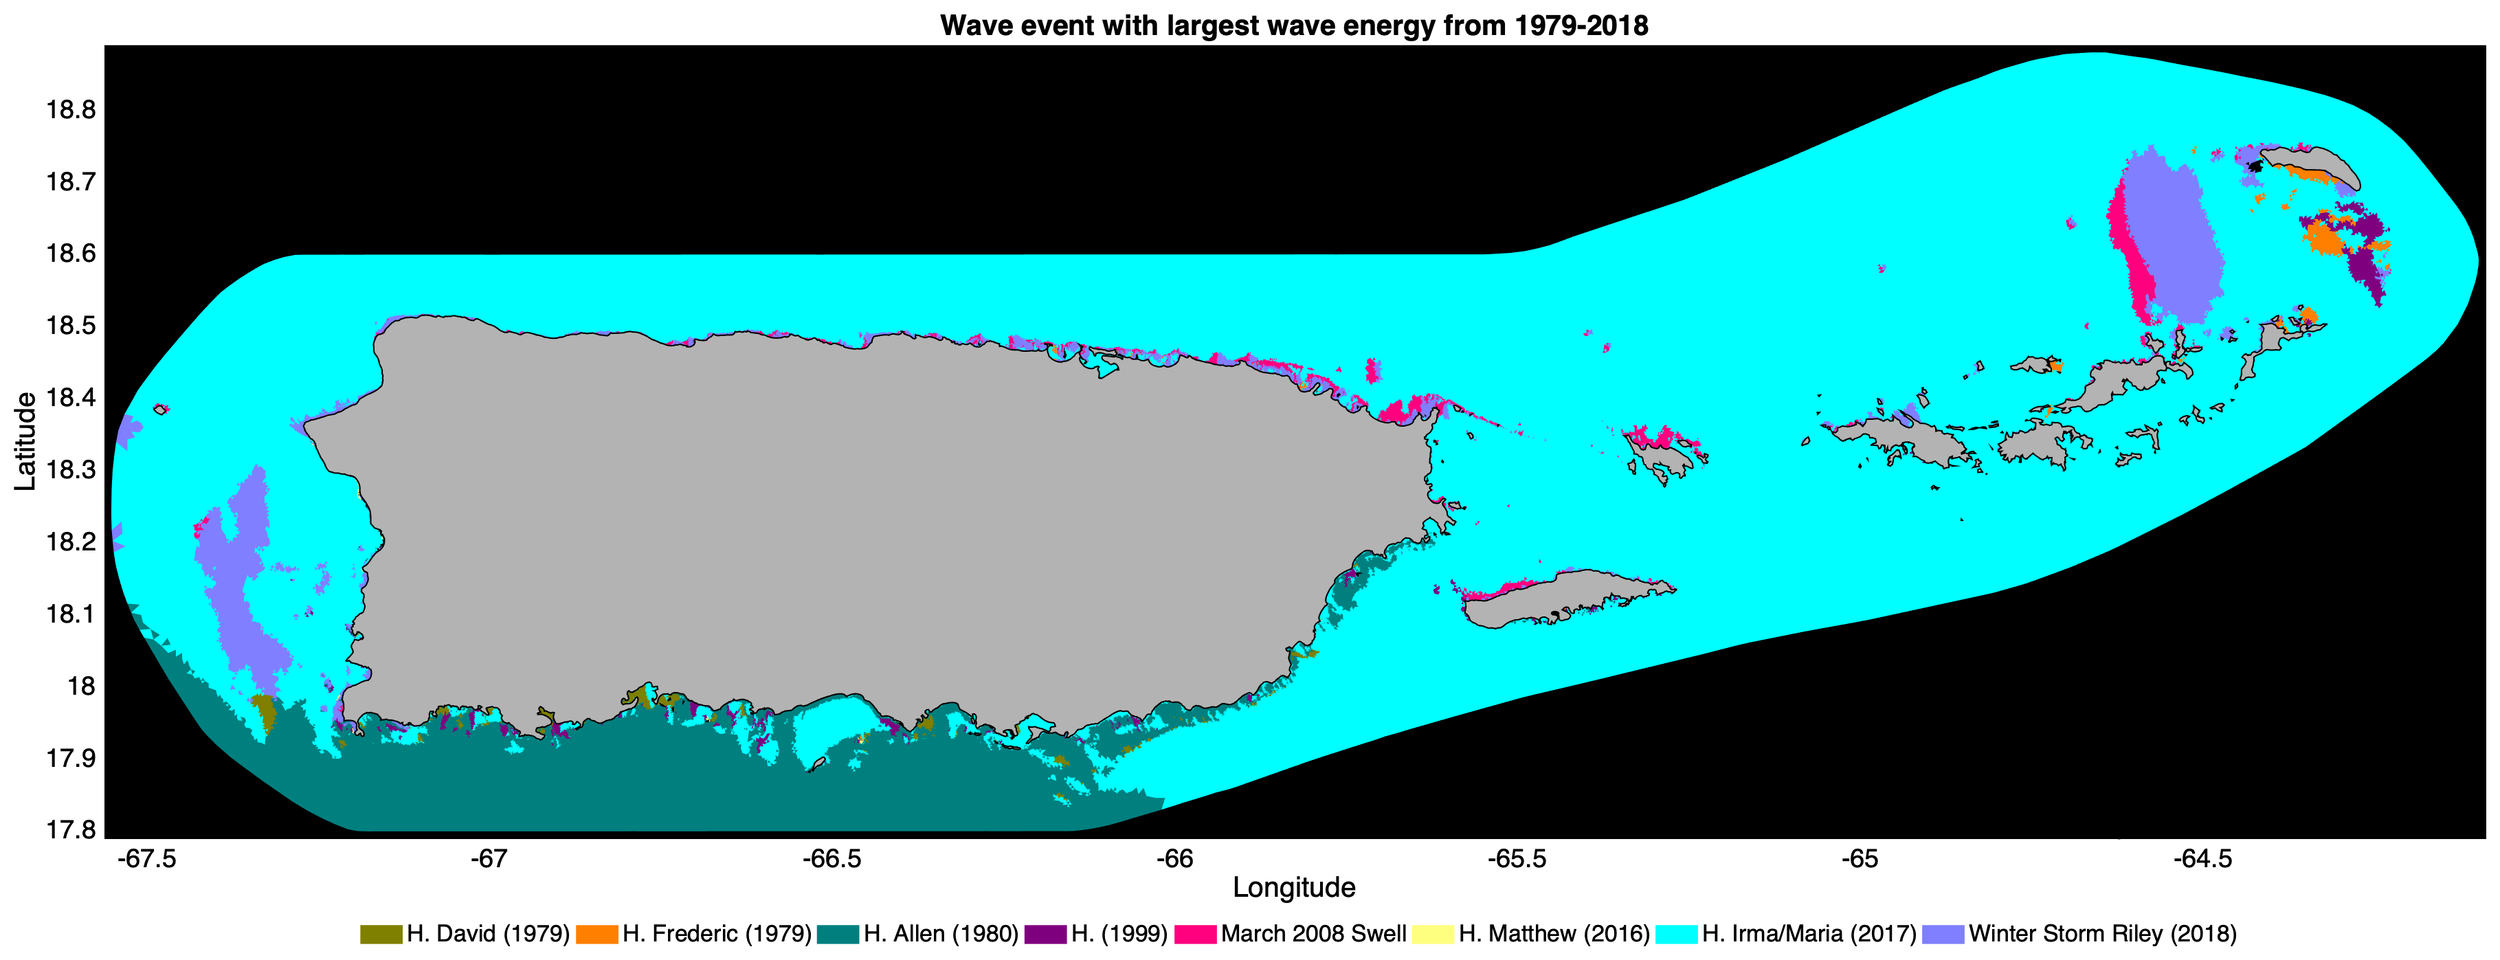
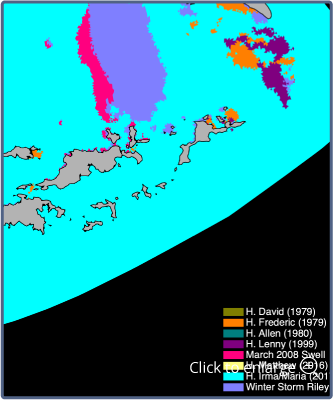
Puerto Rico is subject to extreme wave events ranging from Category 5 Hurricanes such as Hurricanes Irma and María to strong winter swells such as the one generated by Winter Storm Riley in March 2018. Rare but moderate-sized wave events such as Hurricane Lenny (1999) and Hurricane Matthew (2016) also play a major role in shaping our coastlines and causing erosion, accretion and damage to coastal infrastructure. The figure below shows a heat map where different colors represent which events caused the largest wave energy (most severe sea state) at each location within the model domain. Note that while the light blue color, which represents Hurricanes Irma and María in 2017, cover a majority fo the domain, there are other events that dominate, most notably Hurricane Allen (1980) in waters off southwestern PR. Also, note that large winter swell events in 2008 and 2018 caused higher wave energy throughout most of the nearshore waters off the northern coast of Puerto Rico than hurricane events.
The figures below show zoomed-in maps of the wave events with the largest wave energy
-
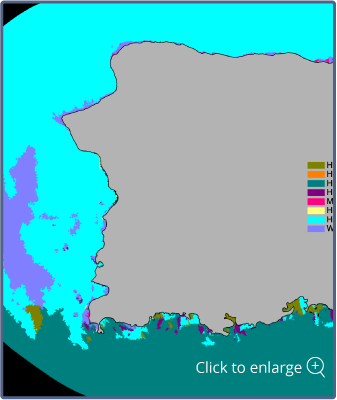 Western Puerto Rico
 -
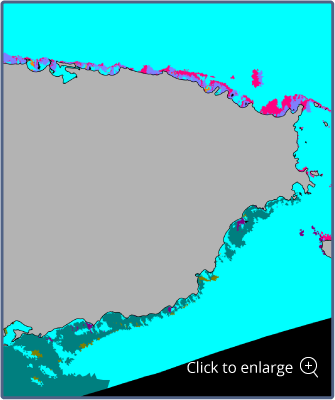 Eastern Puerto Rico
 -
 US Virgin Islands
EXTREME EVENTS: ANIMATIONS
In this section we provide visualizations of wave conditions for the following extreme events:
- Hurricanes David (1979), Allen (1980), Matthew (2016), and Hurricanes Irma and María (2017)
- Hurricane Lenny (1999) and Hurricane Omar (2008), both “left-handed” hurricanes that passed south of Puerto Rico
- Strong winter swells in October 1991 (The “Perfect” Storm), February 1999, March 2008 (“Holy Swell”), and March 2018 (Winter Storm Riley), among others
Hurricane Events:
-
 HURRICANE DAVID (1979)
-
 HURRICANE ALLEN (1980)
-
 HURRICANE LENNY (1999)
-
 HURRICANE OMAR (2007)
-
 HURRICANE MATTHEW (2016)
-
 HURRICANE MARIA (2017)