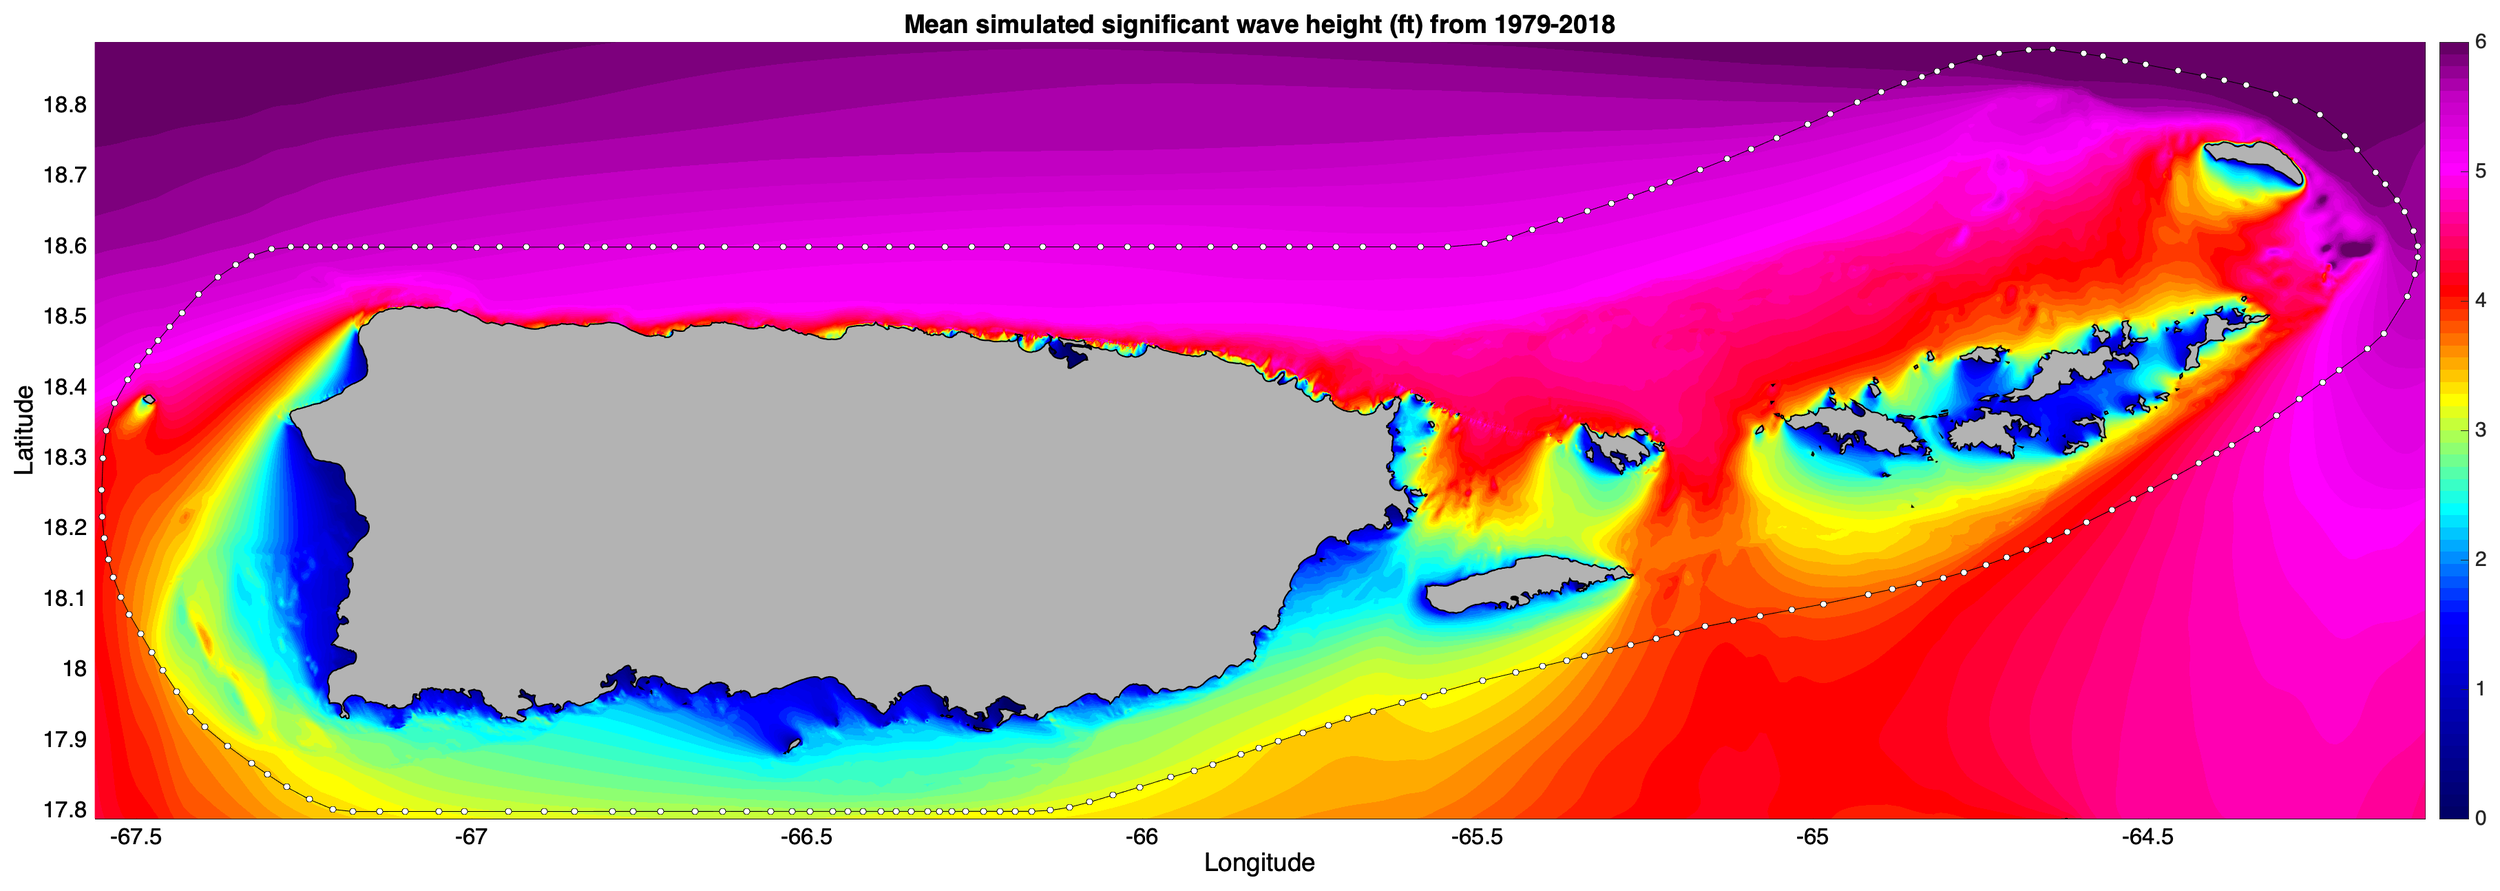
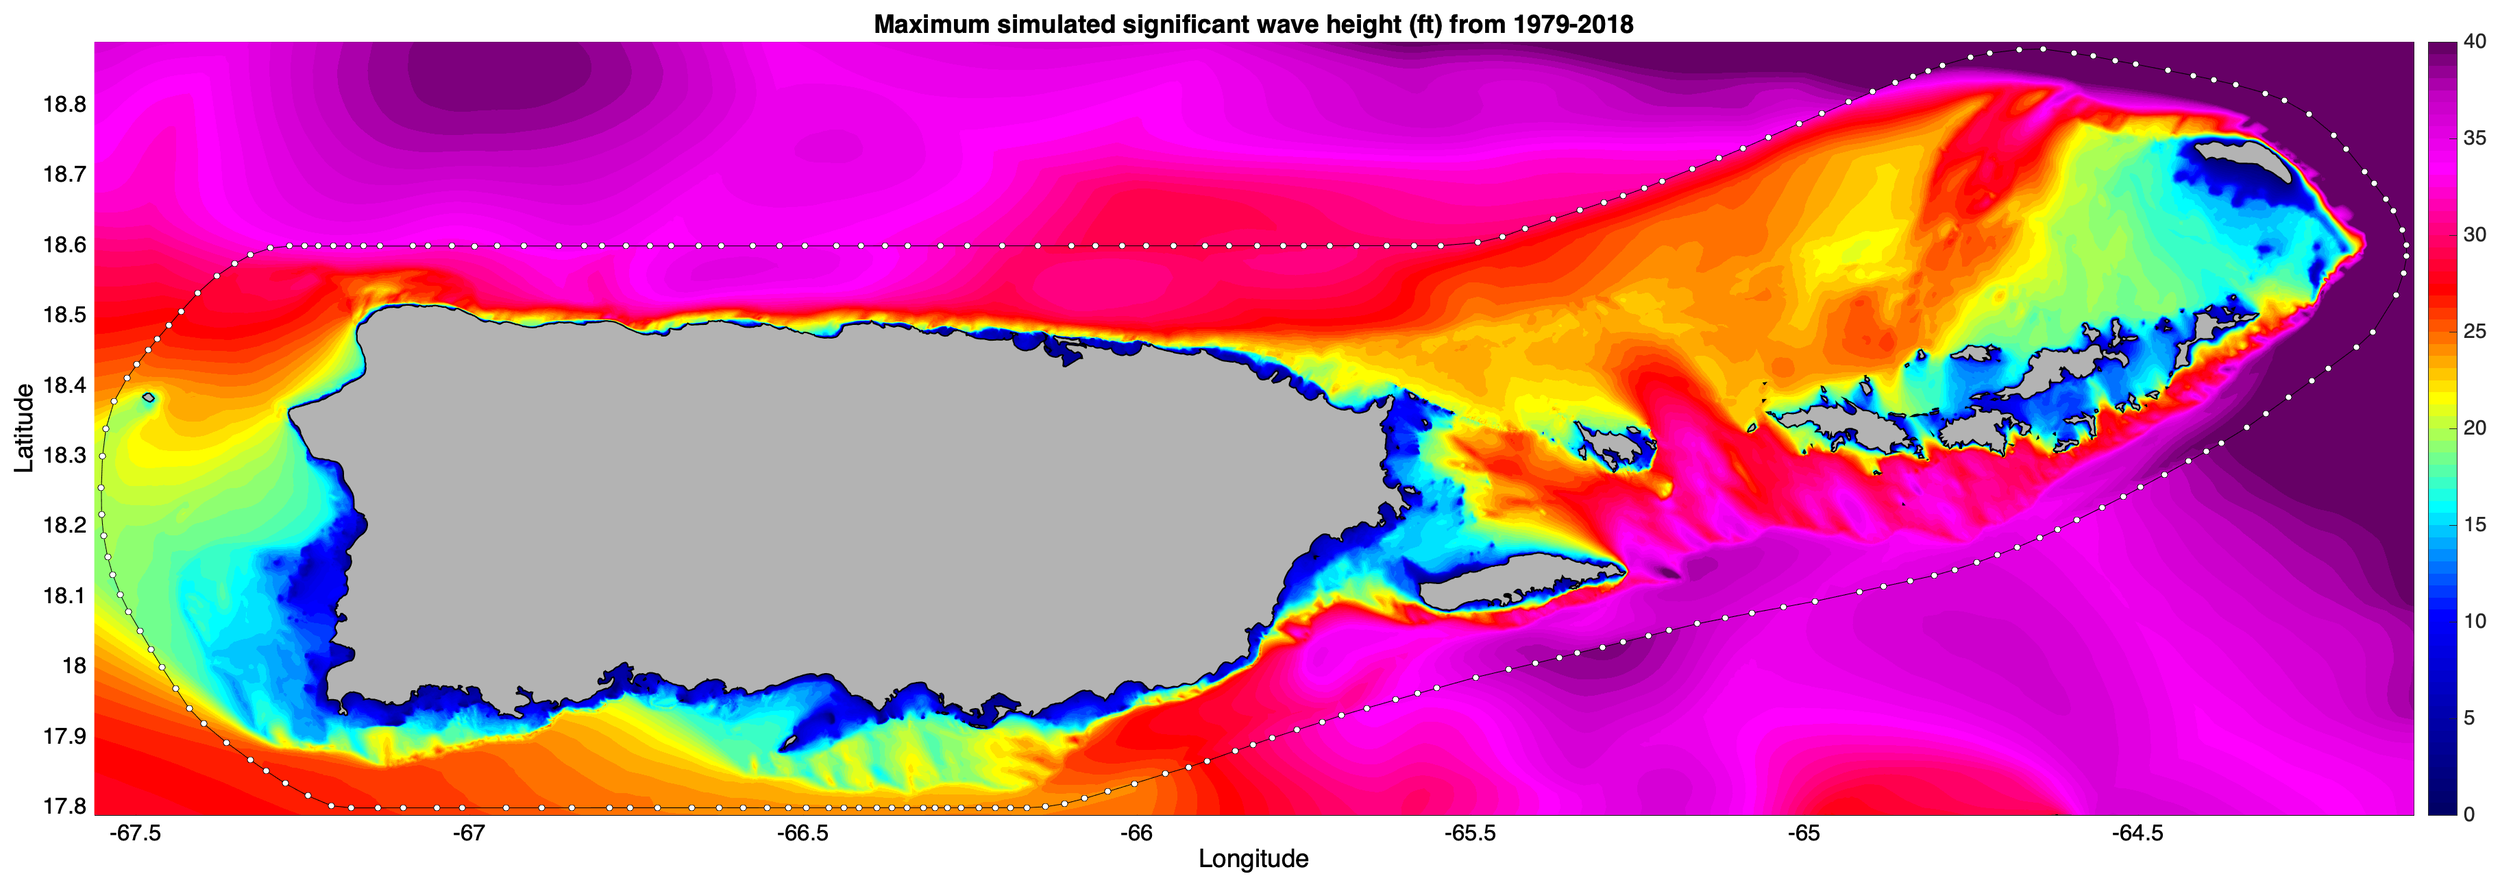
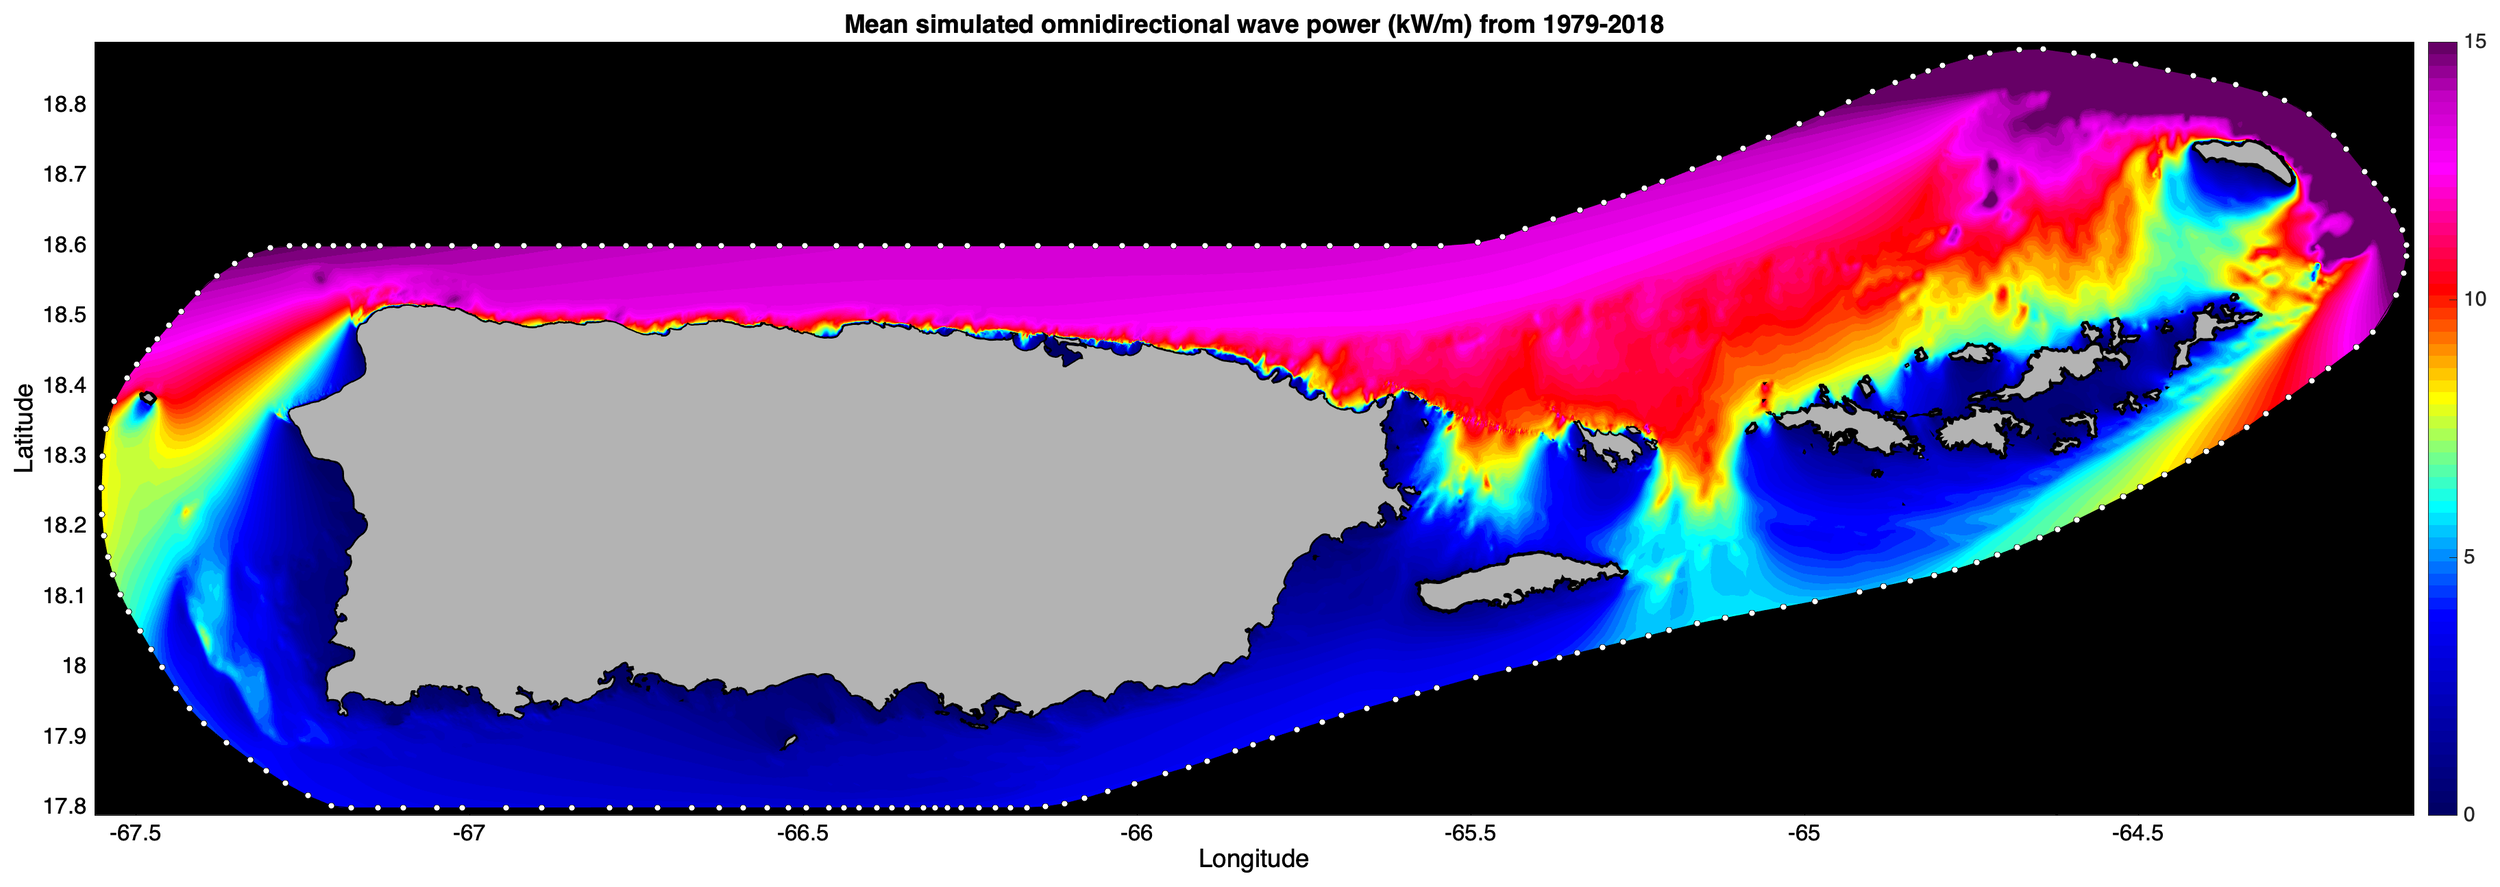
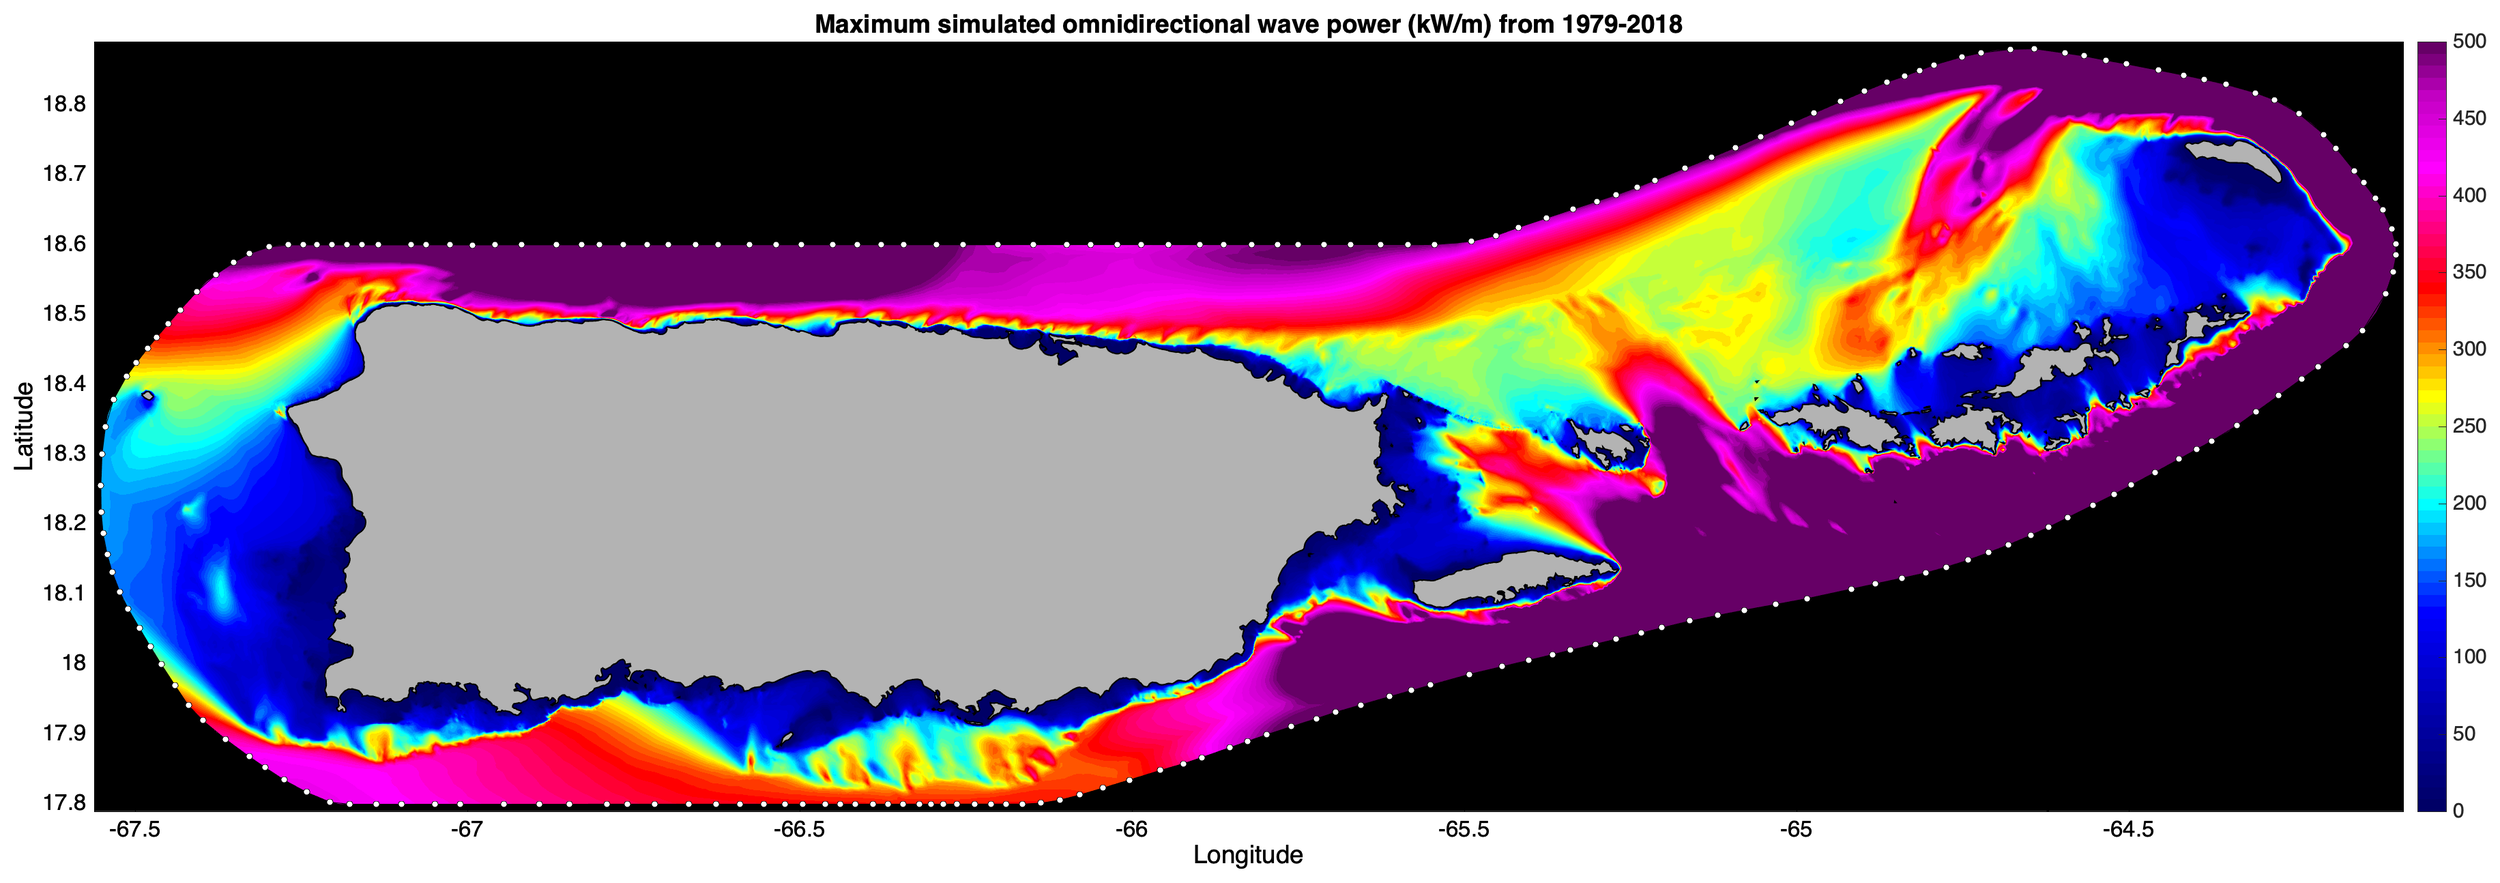
The figures below (click on thumbnail for high-resolution version) show maps of different statistical quantities that characterize Puerto Rico’s wave climate. All of the regional map products contain simulations from January 1, 1979 to December 31, 2018 for the following variables:
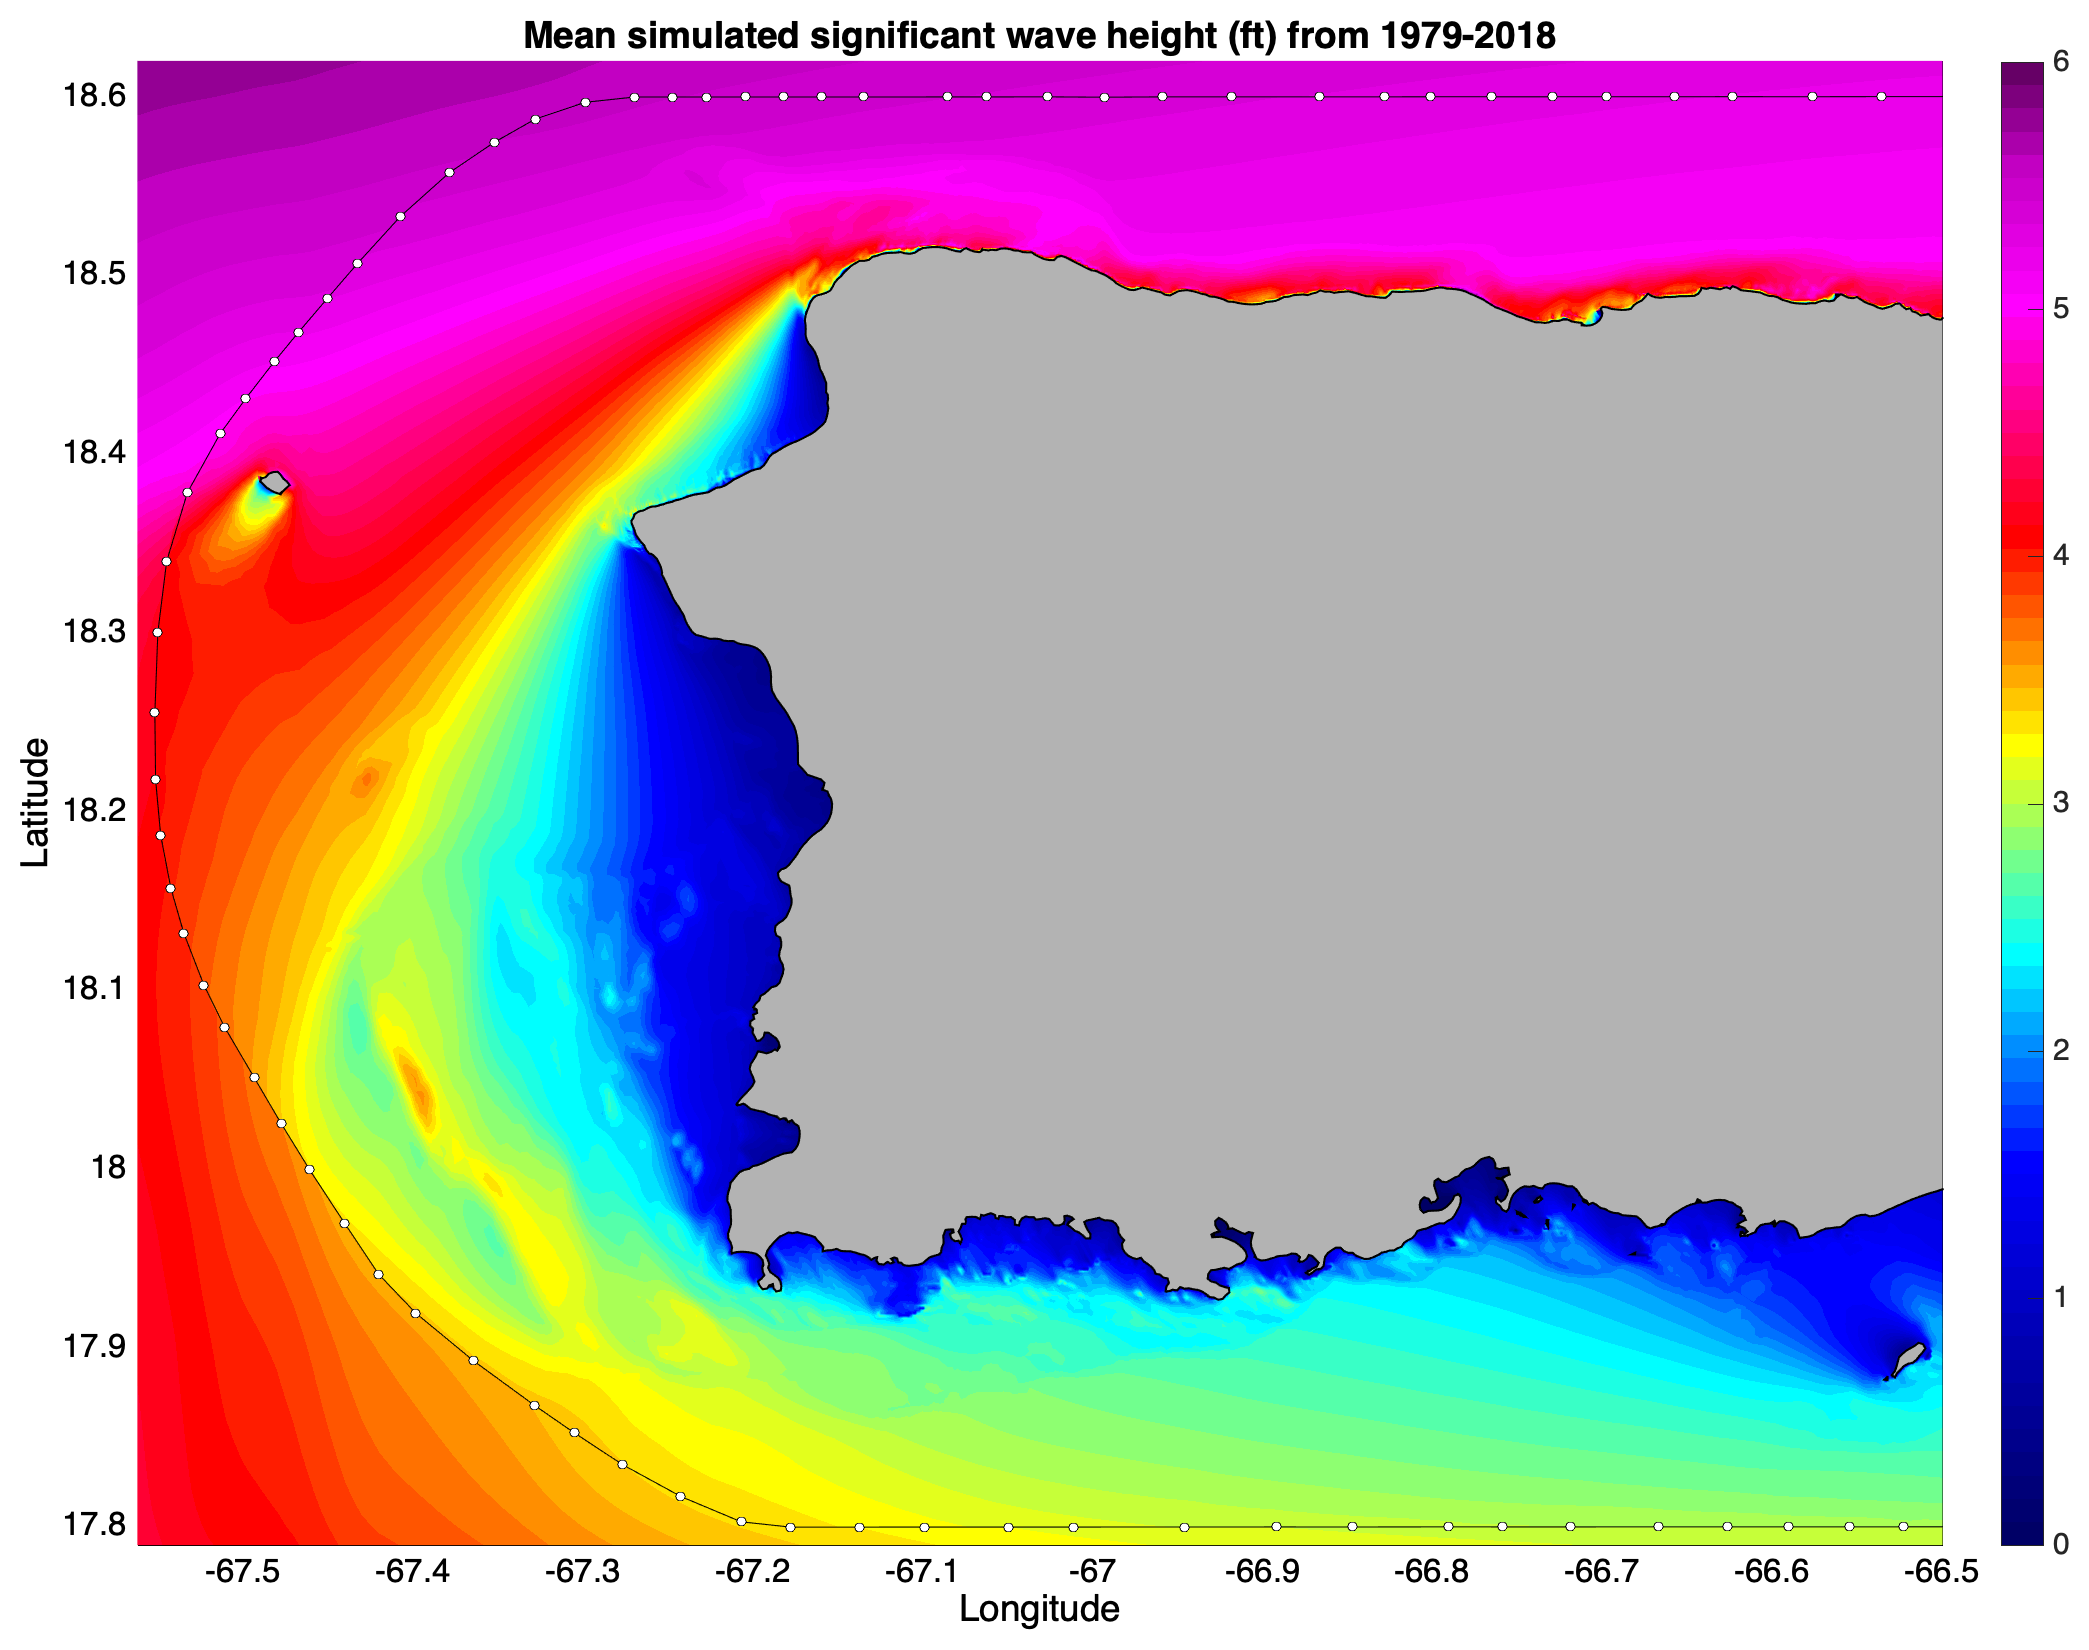
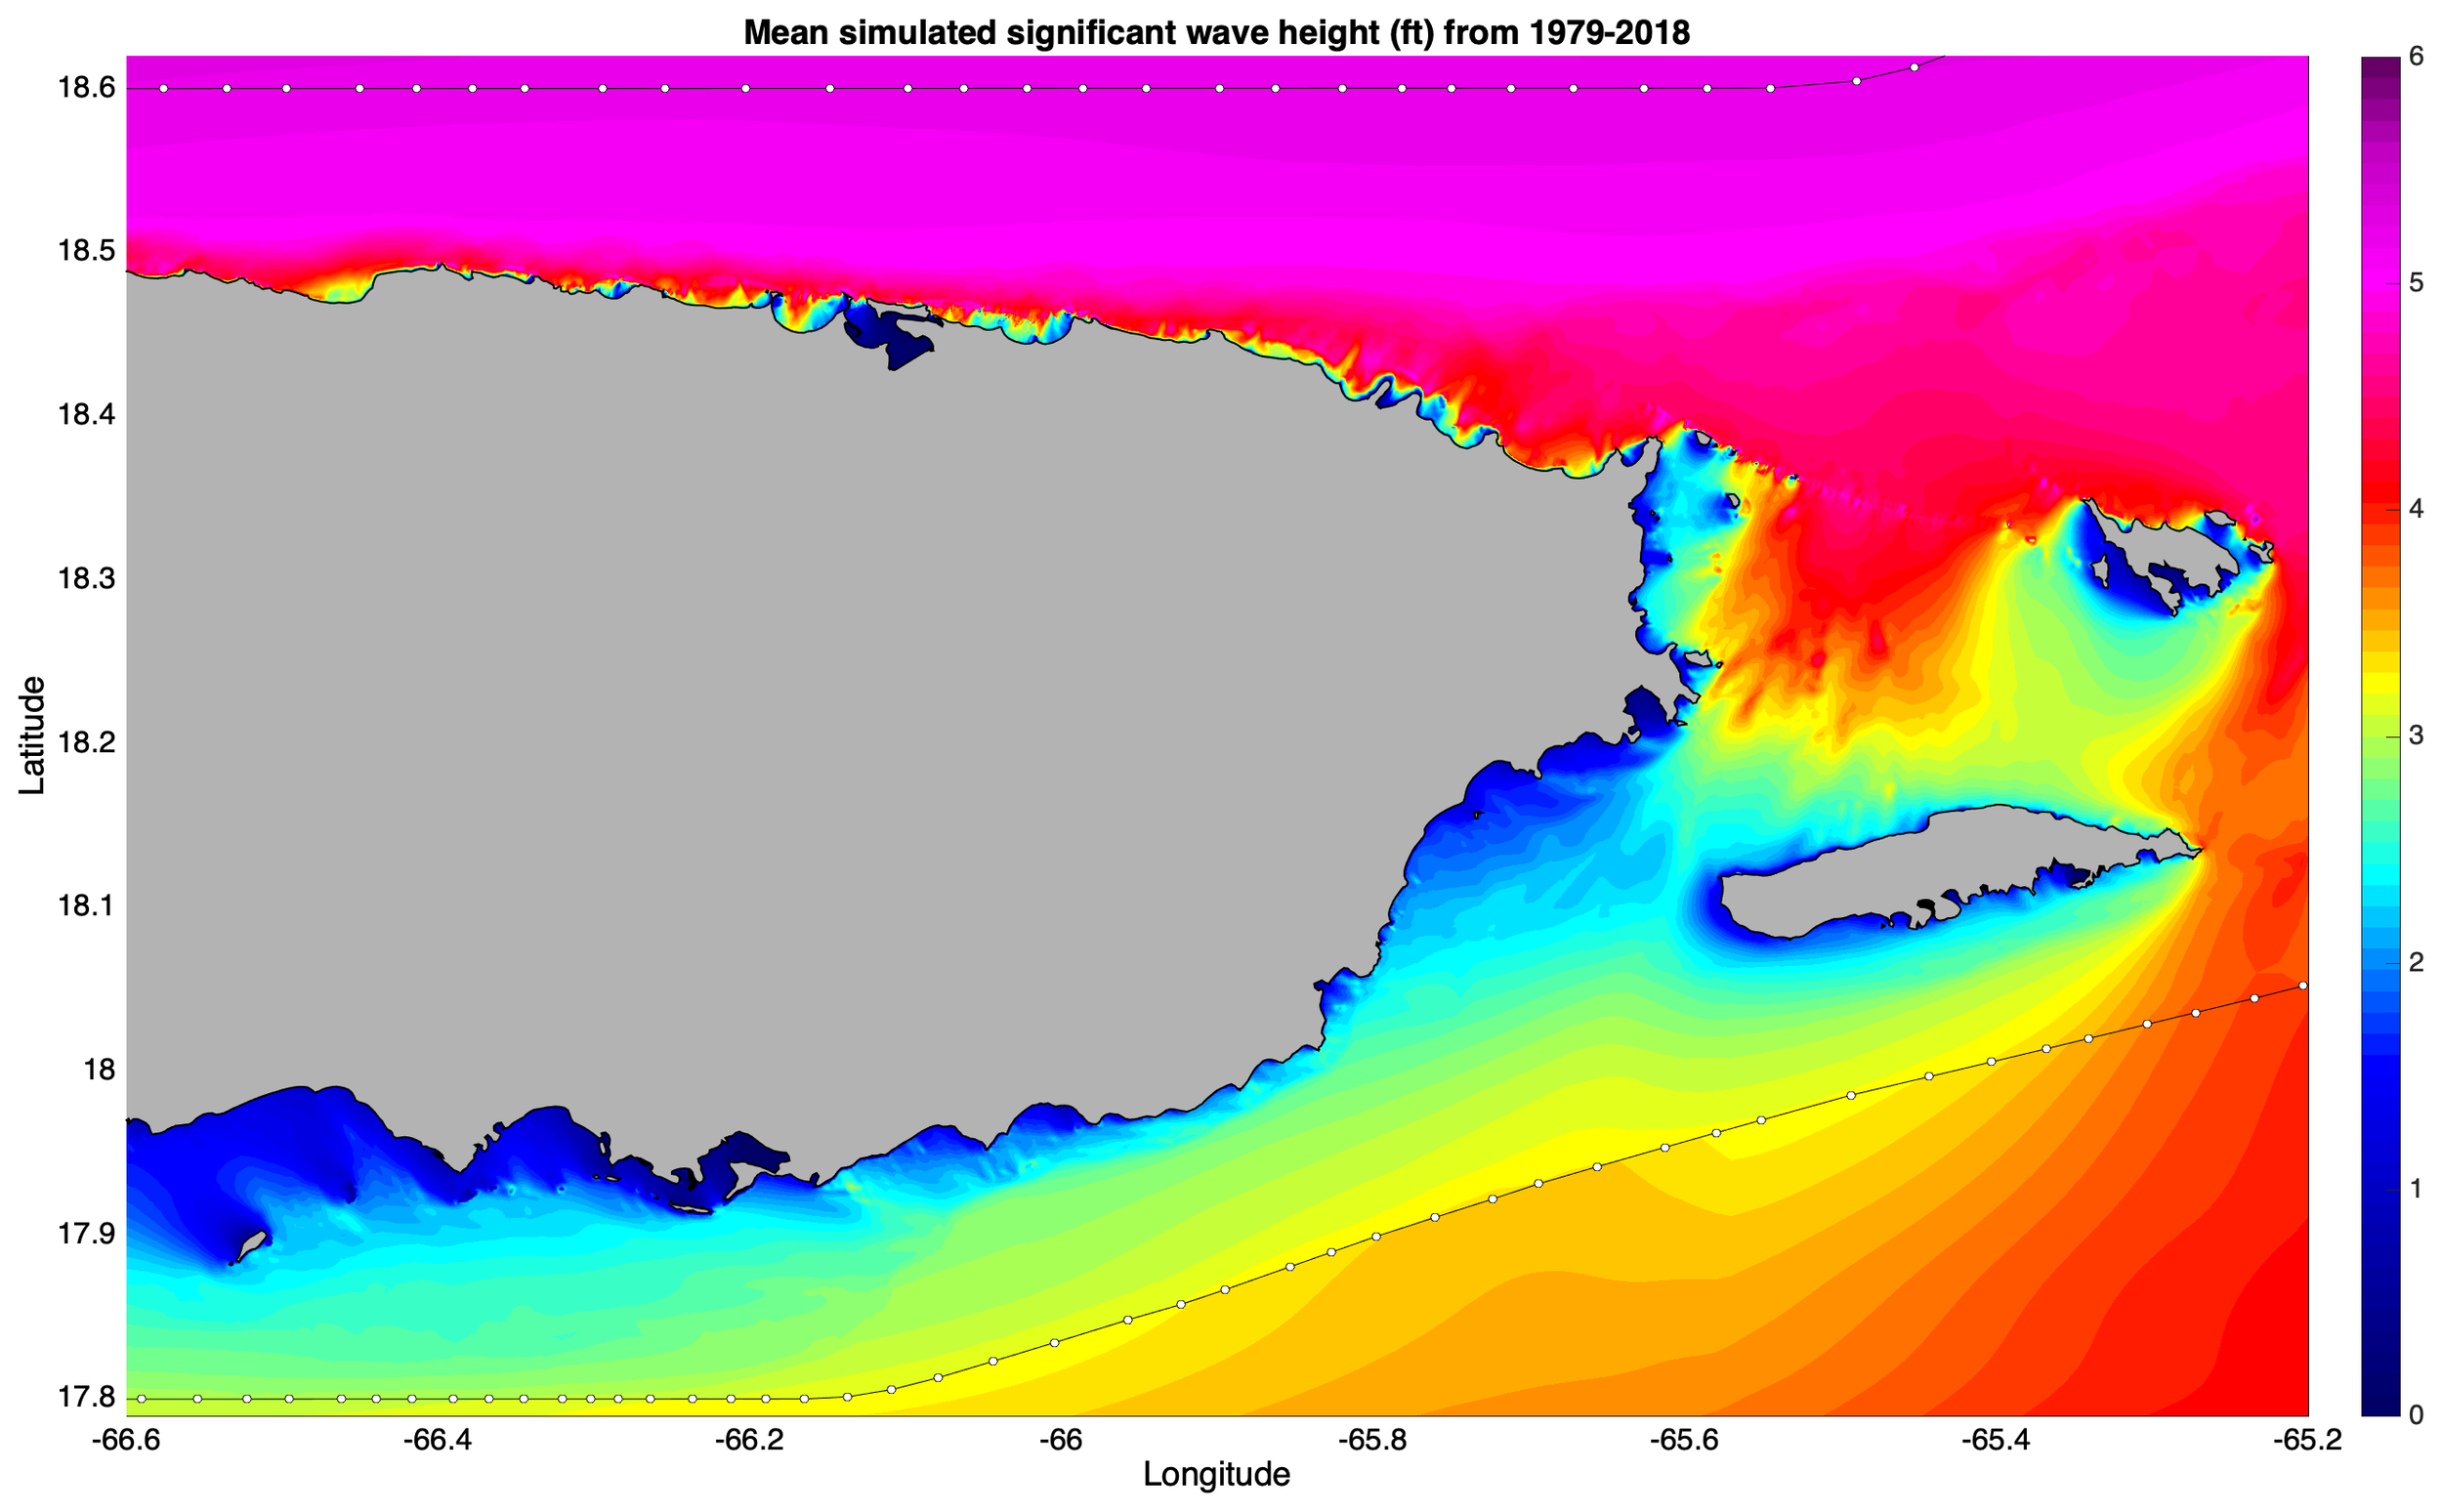
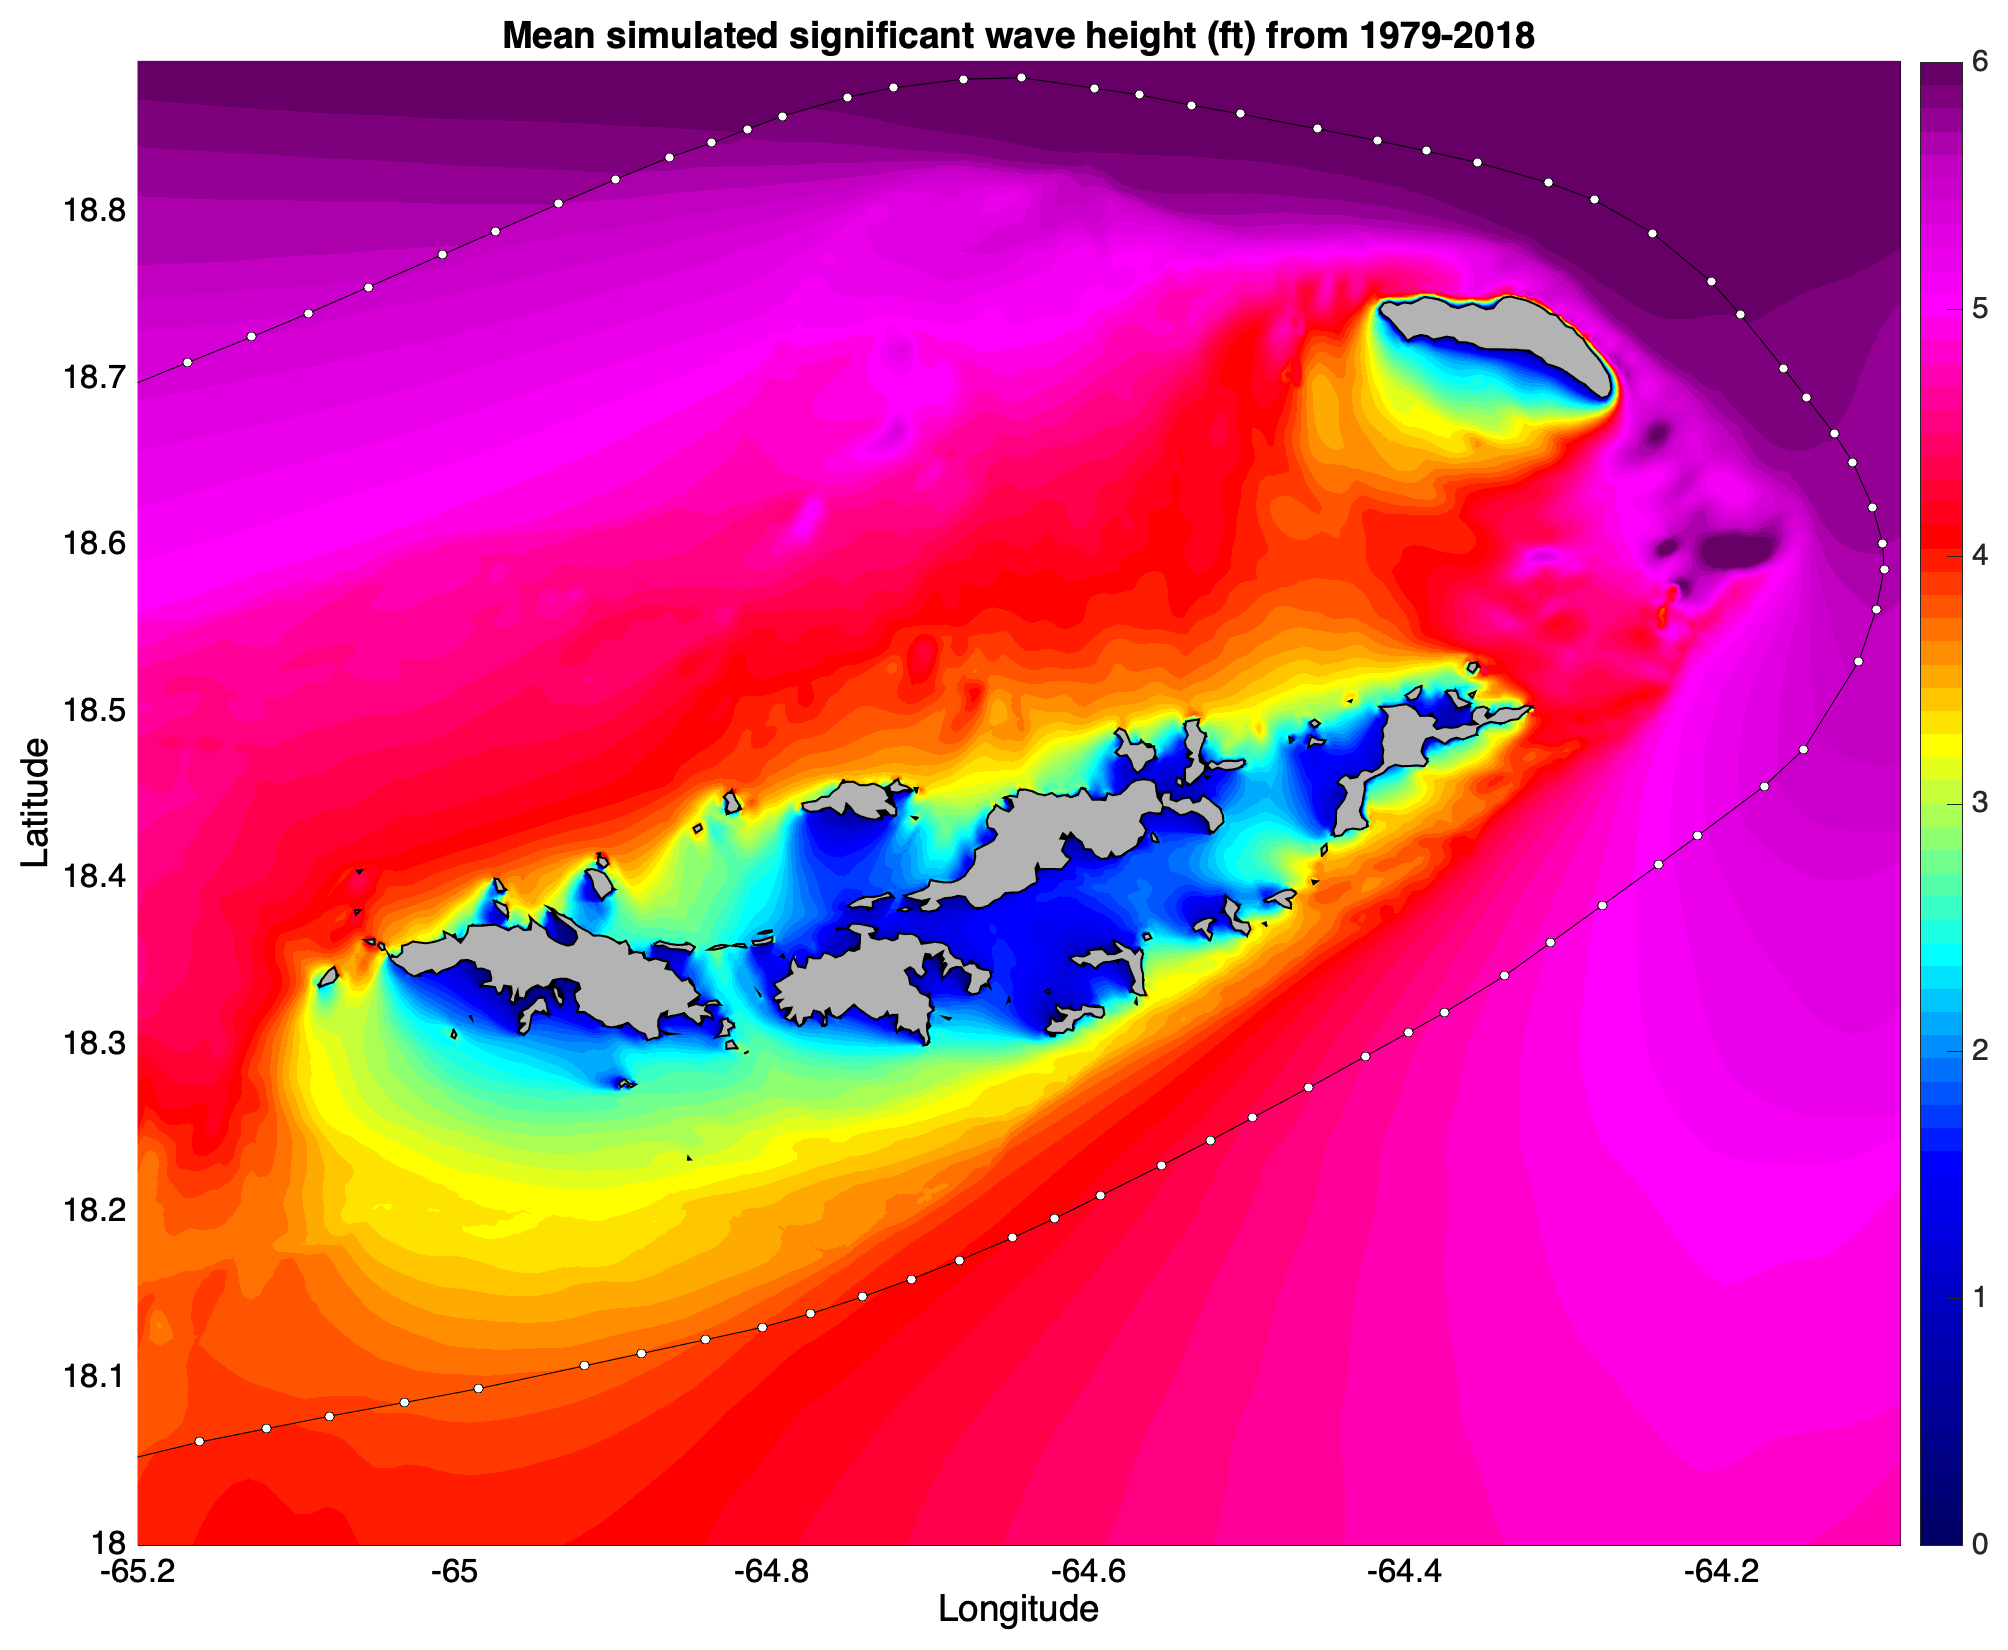
- Mean significant wave height (in feet)
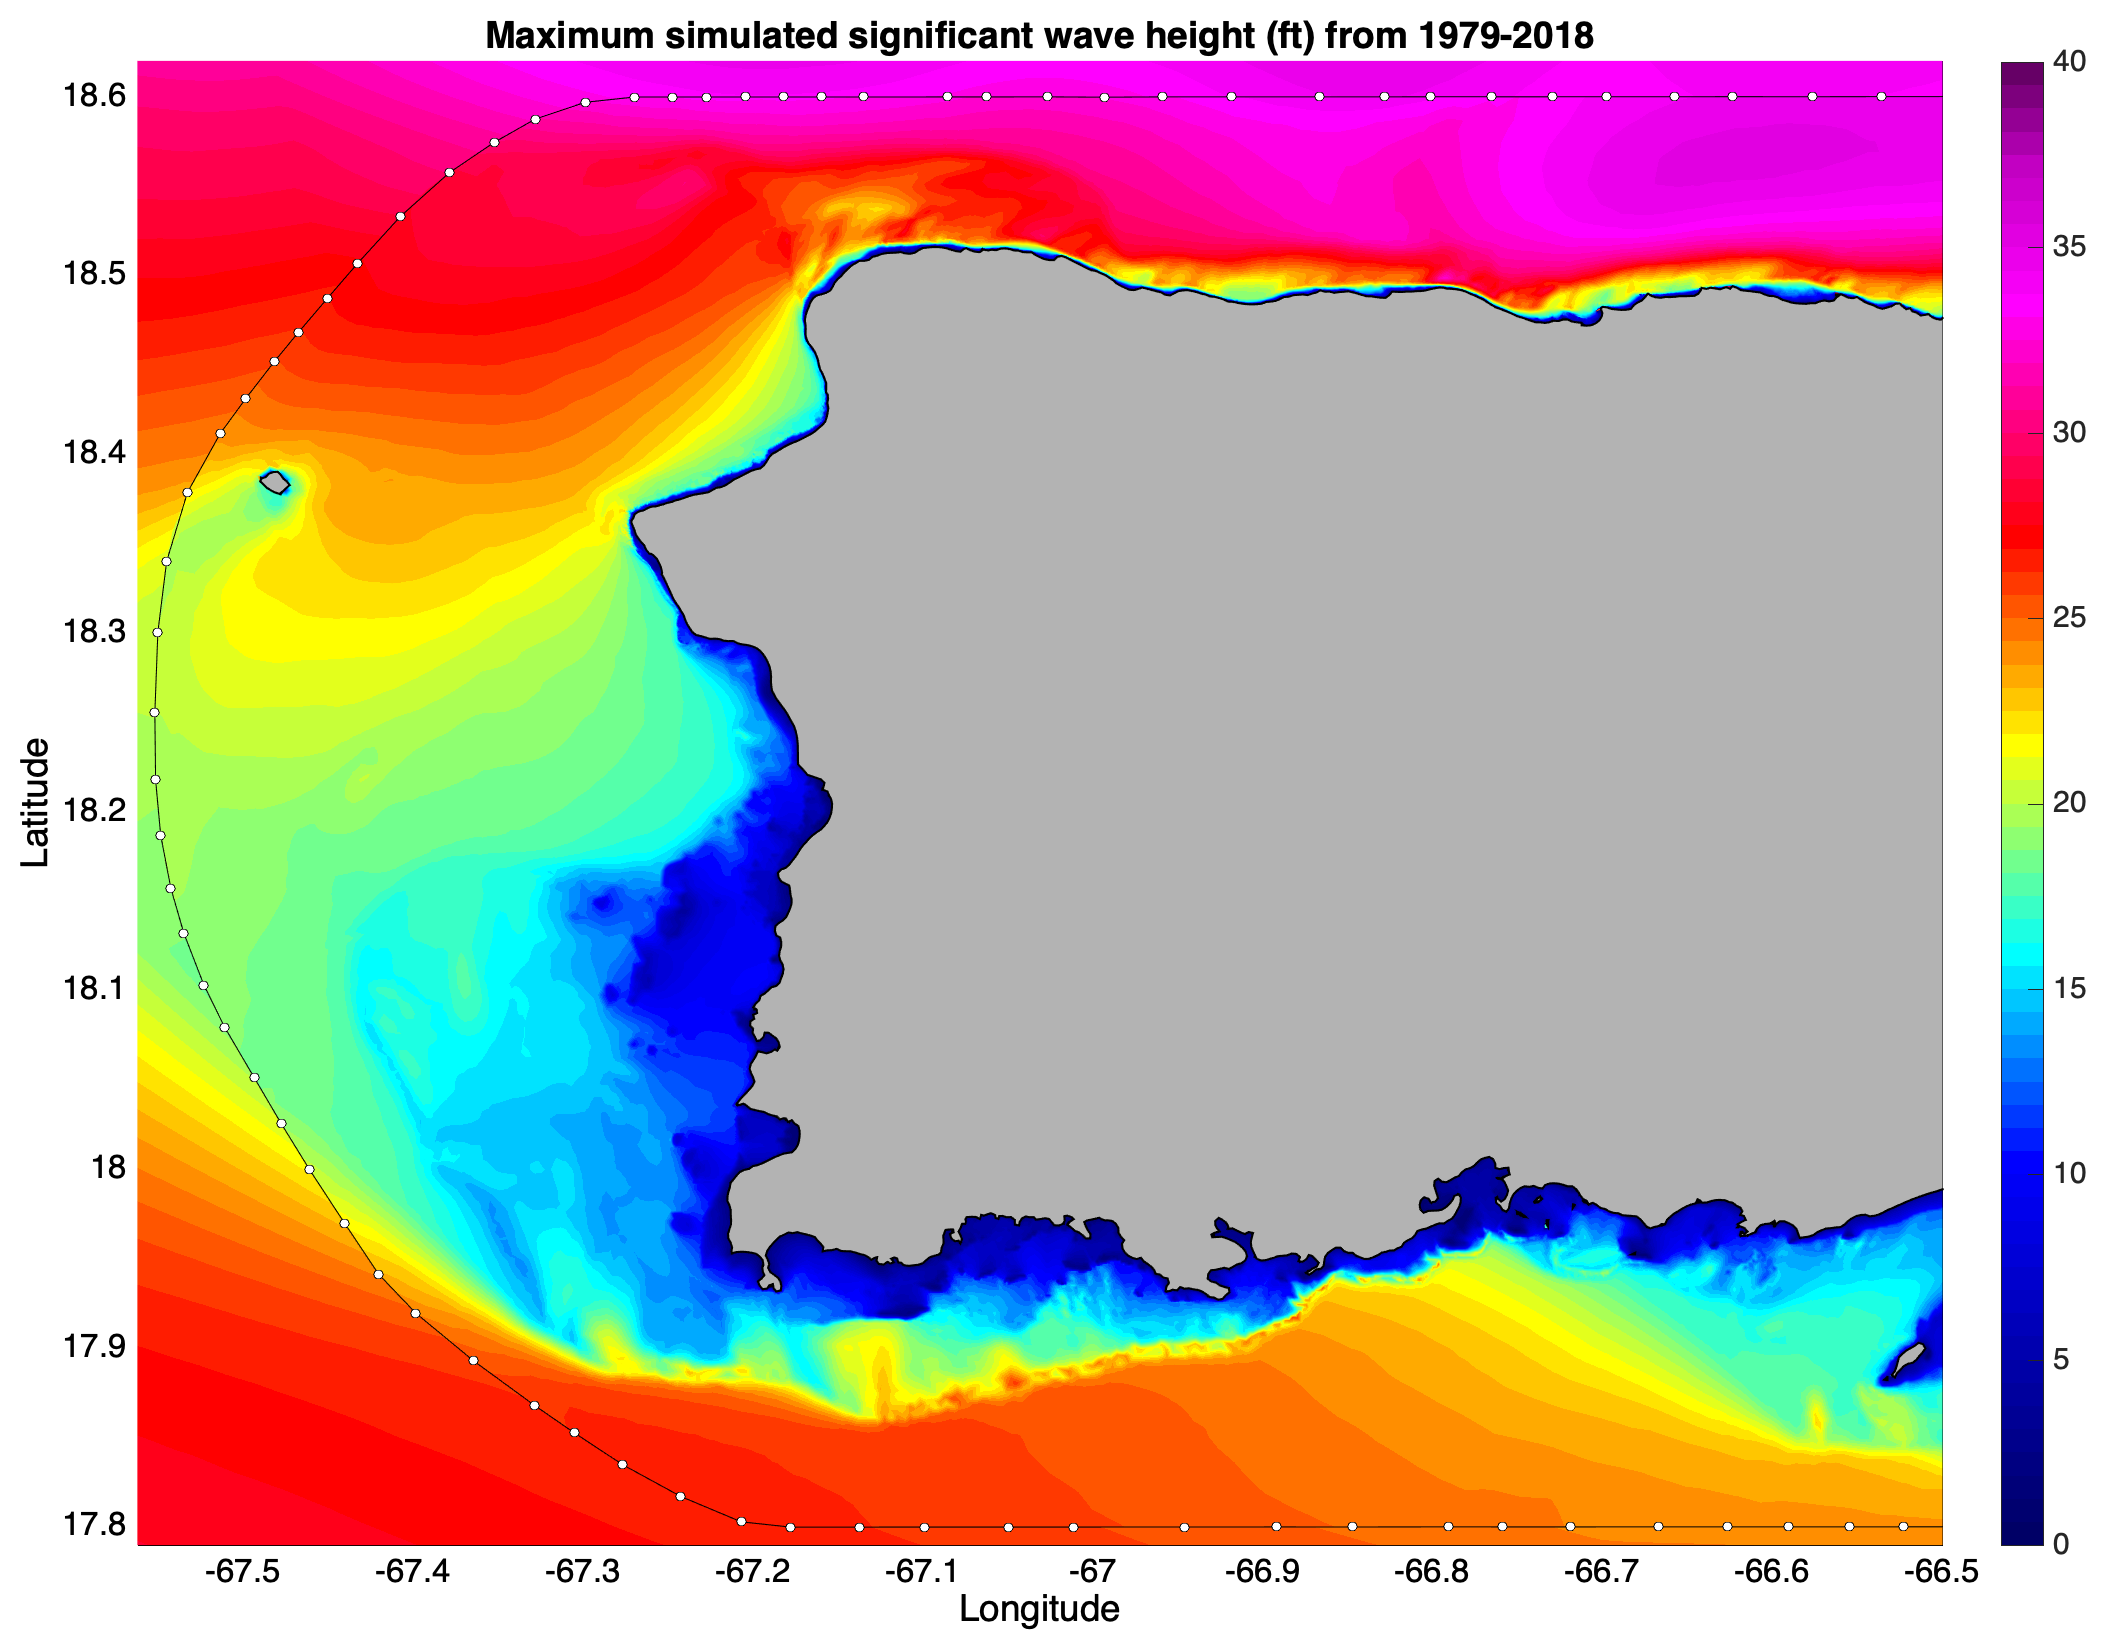
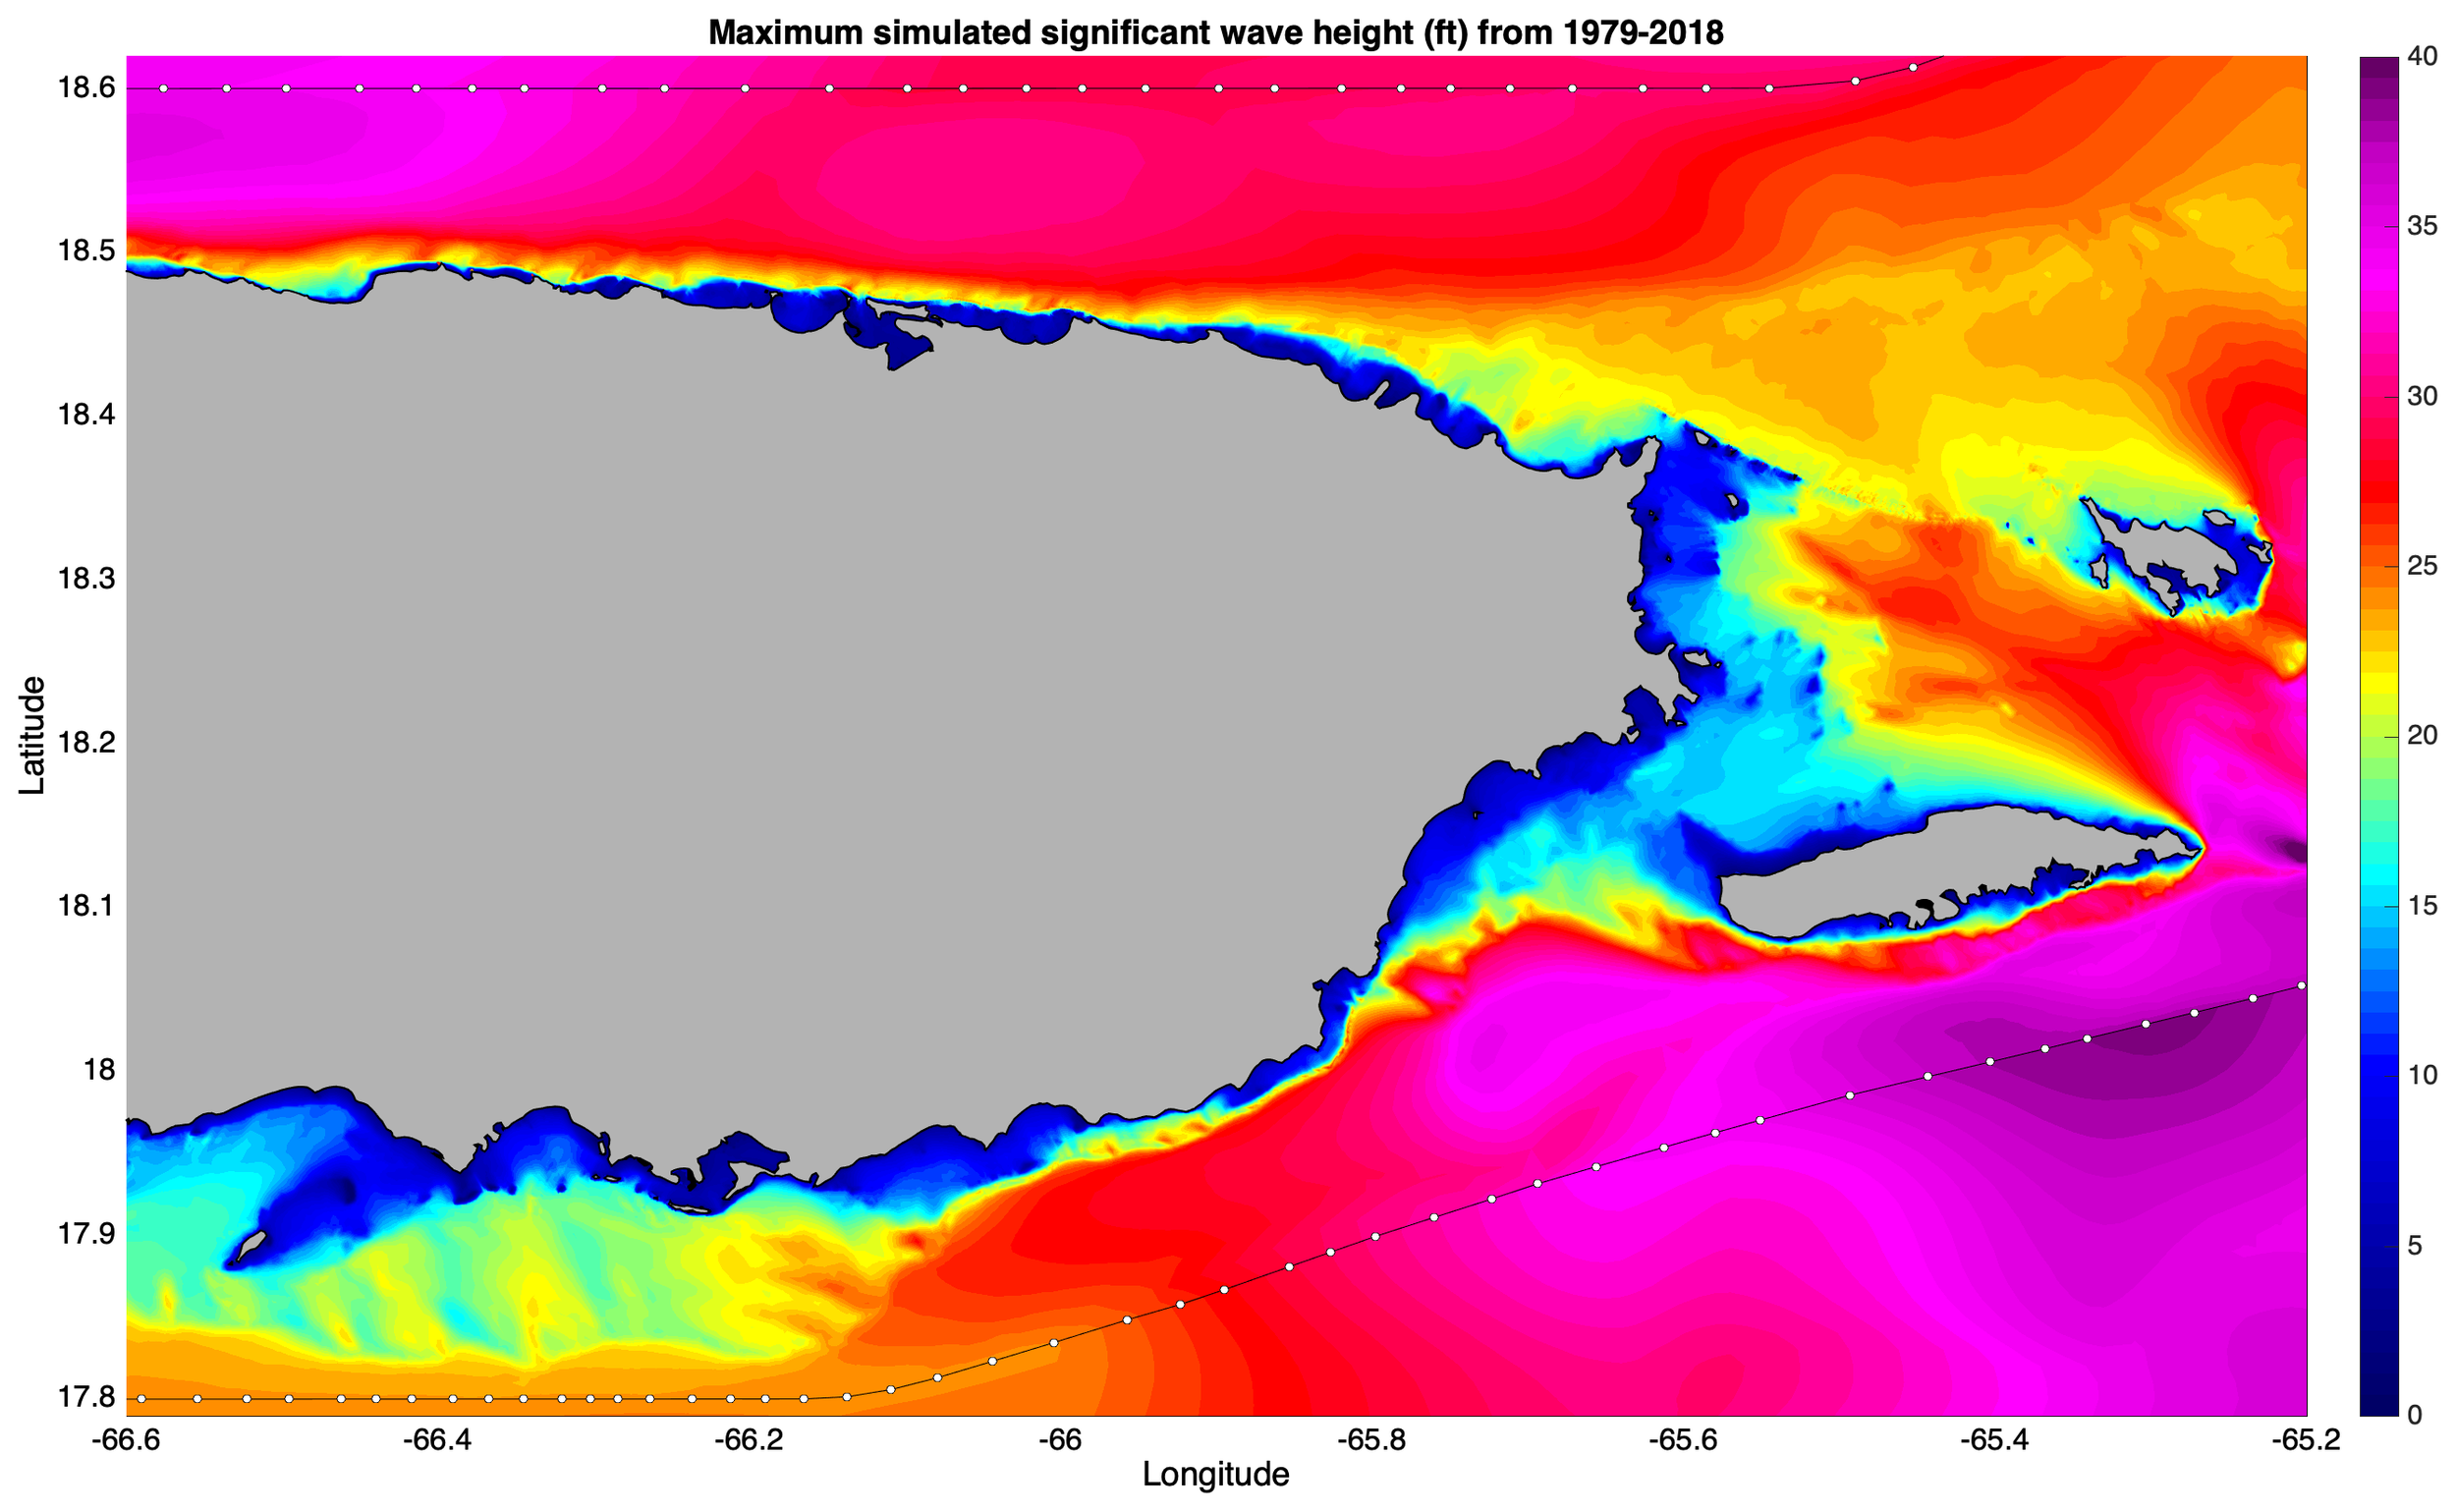
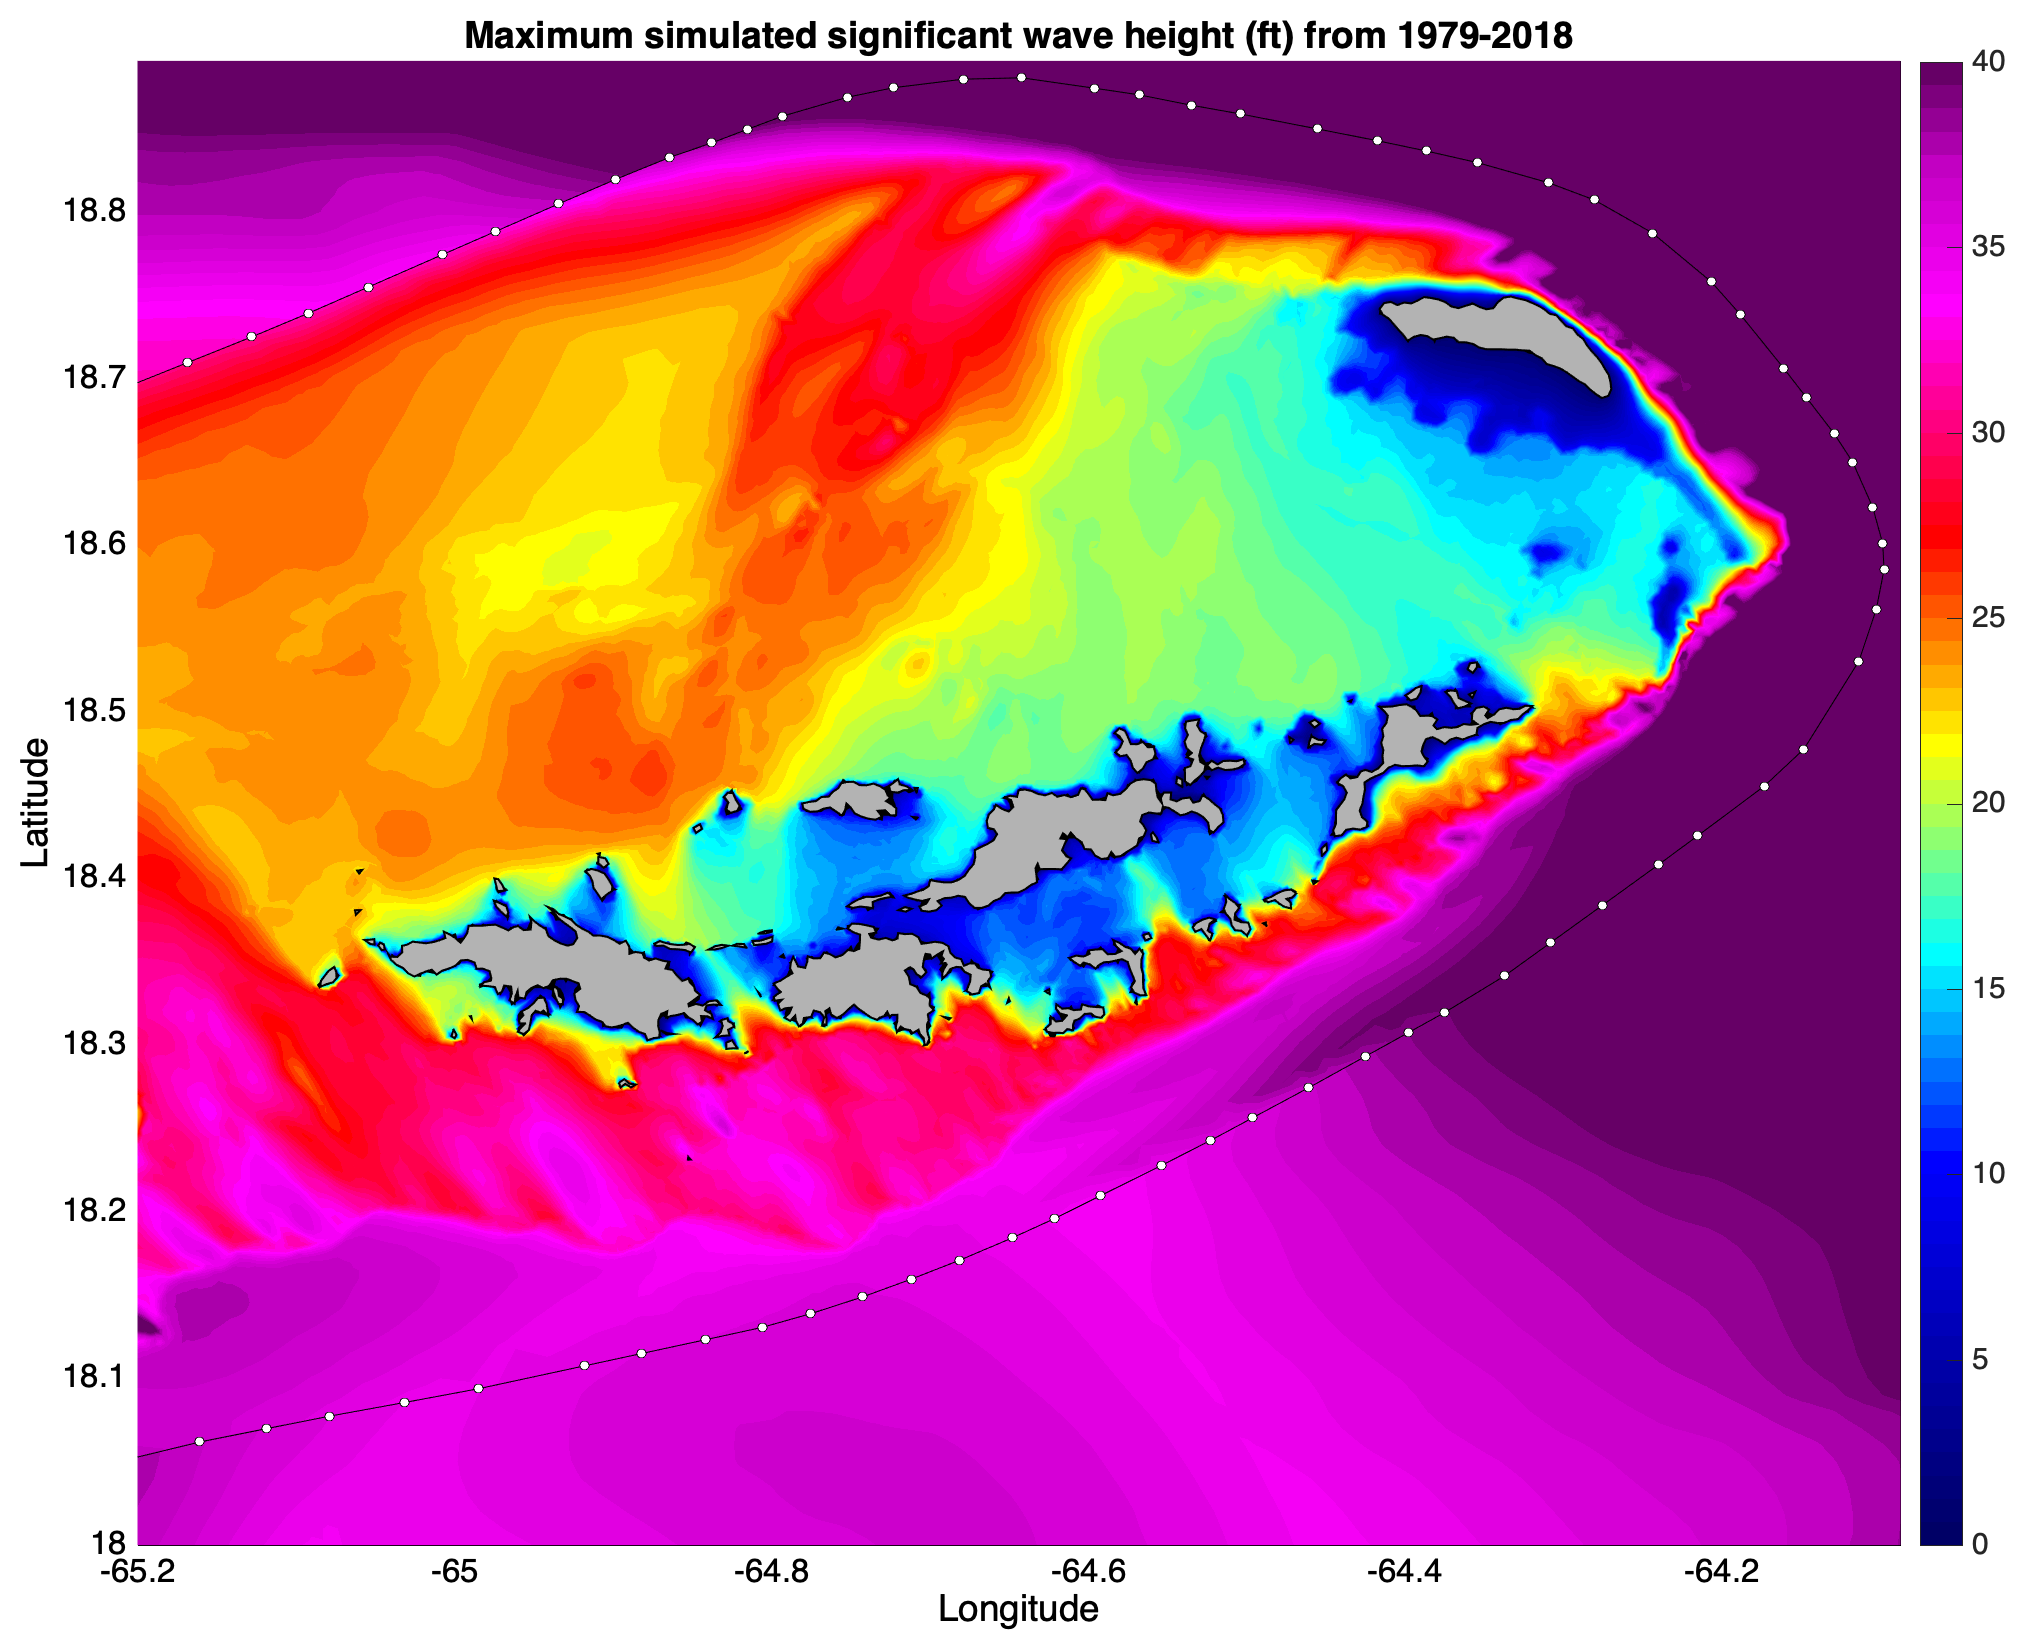
- Maximum significant wave height (in feet)
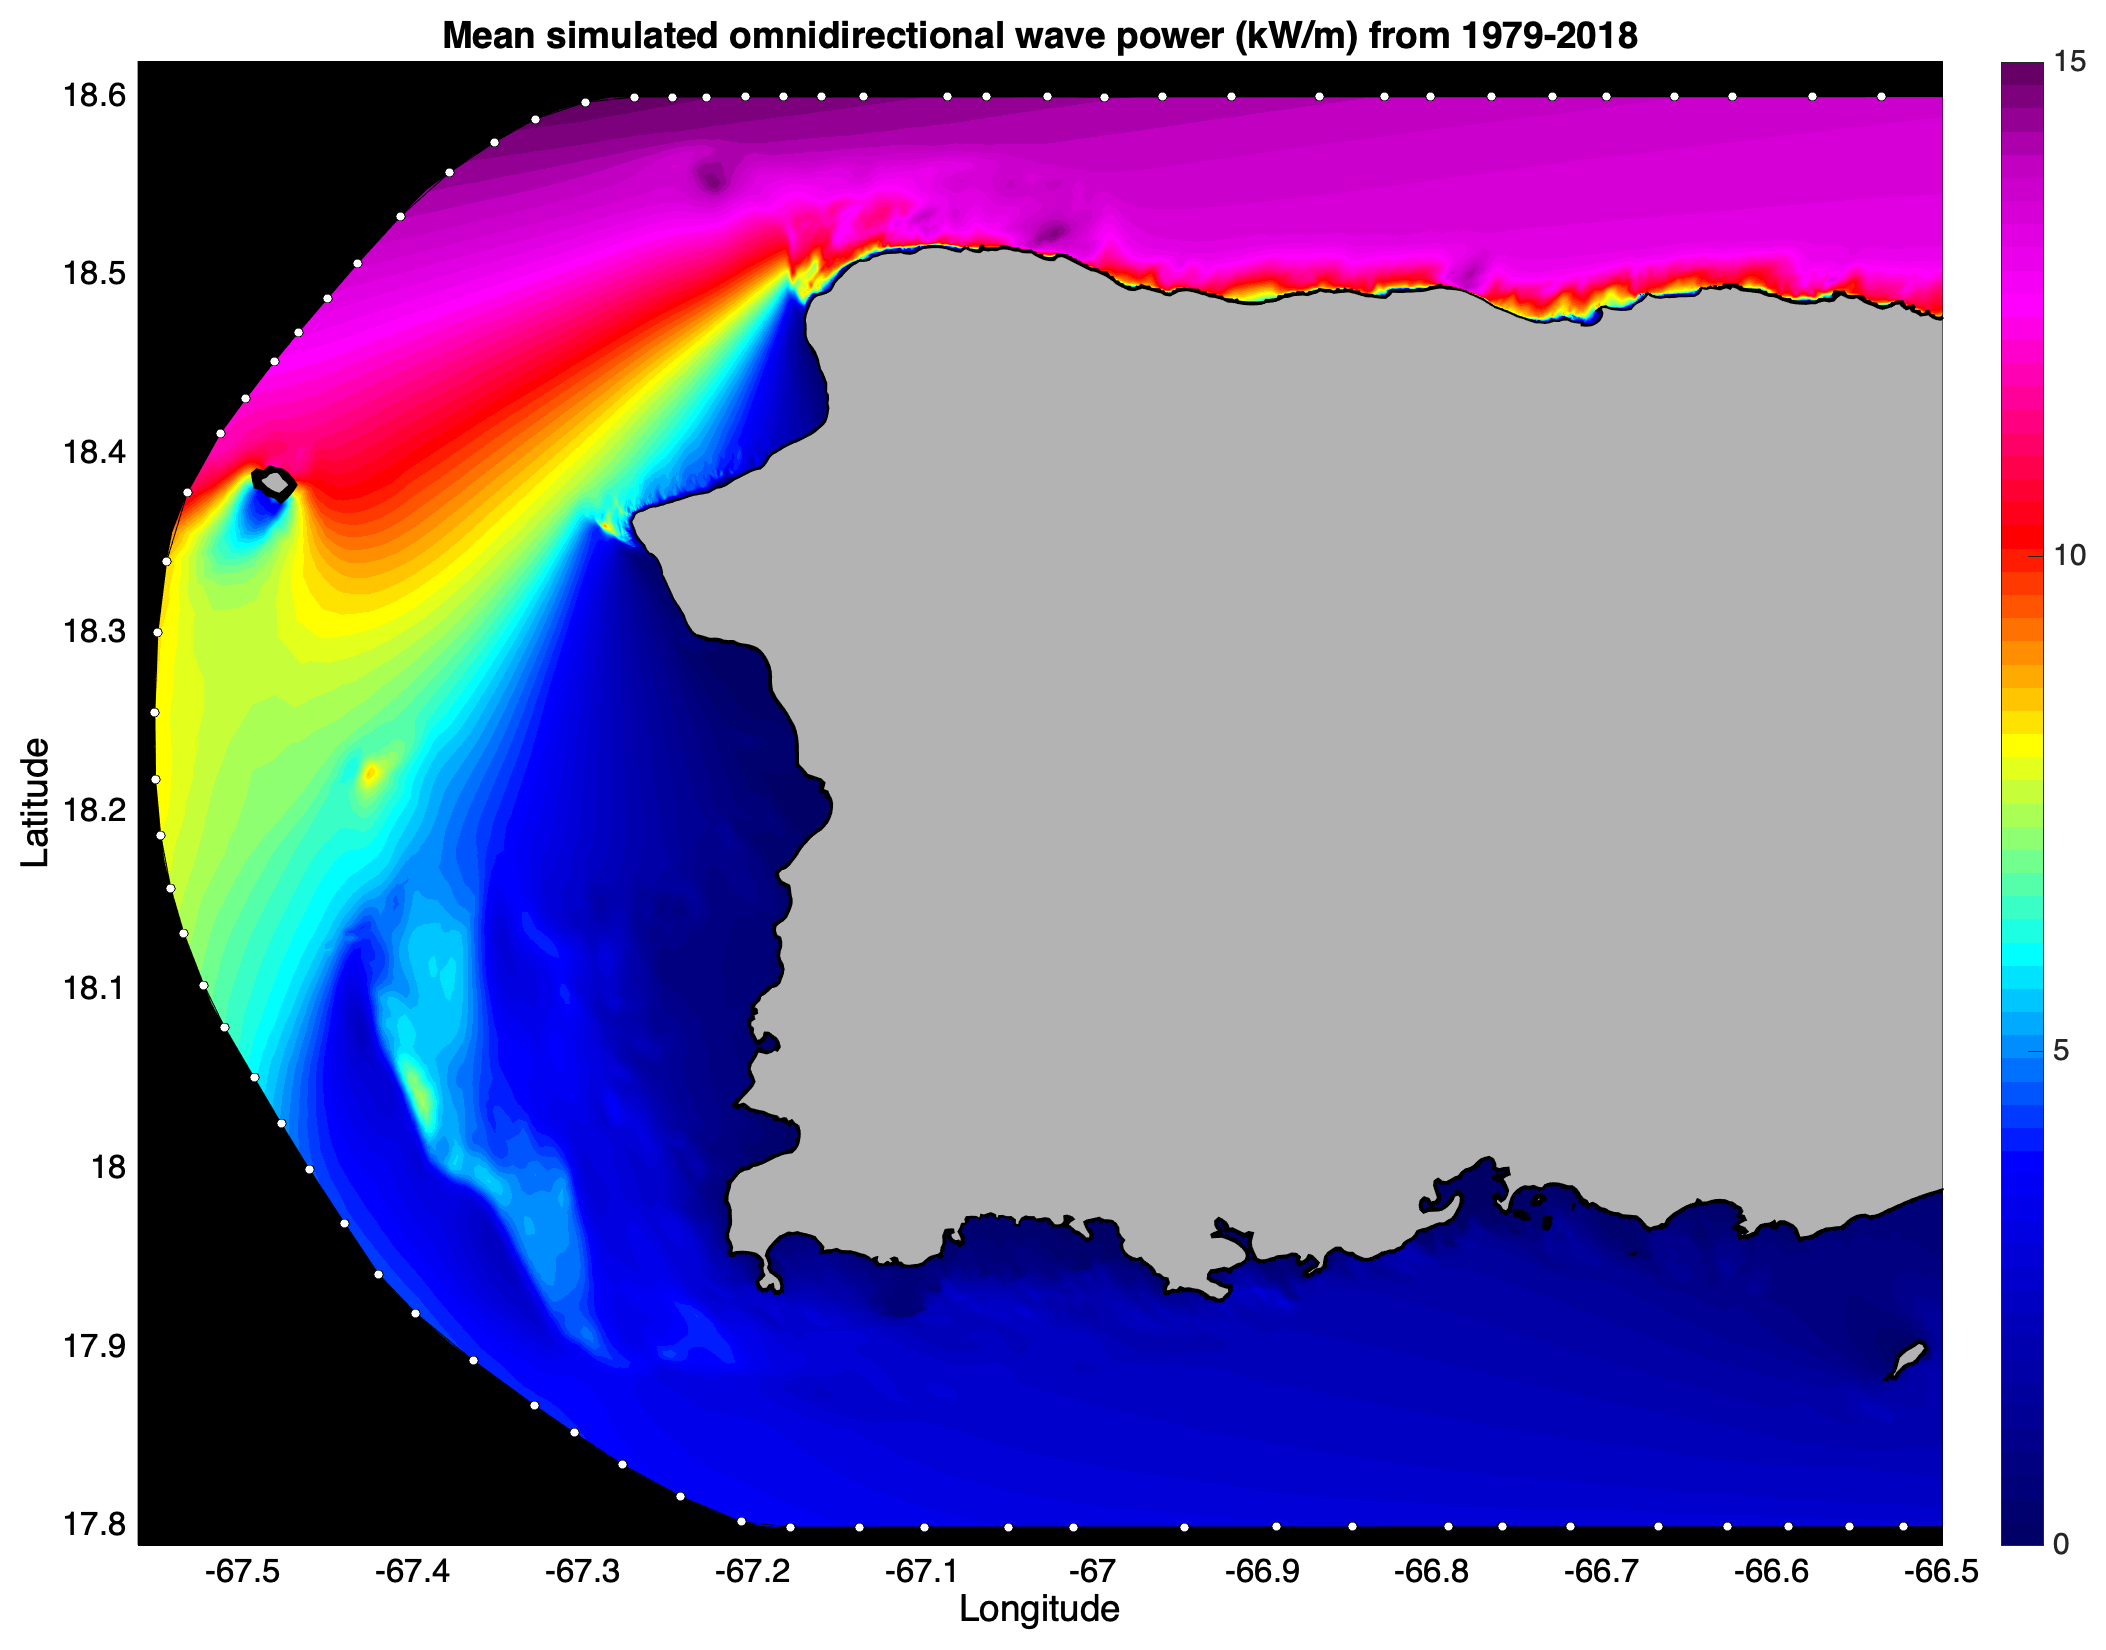
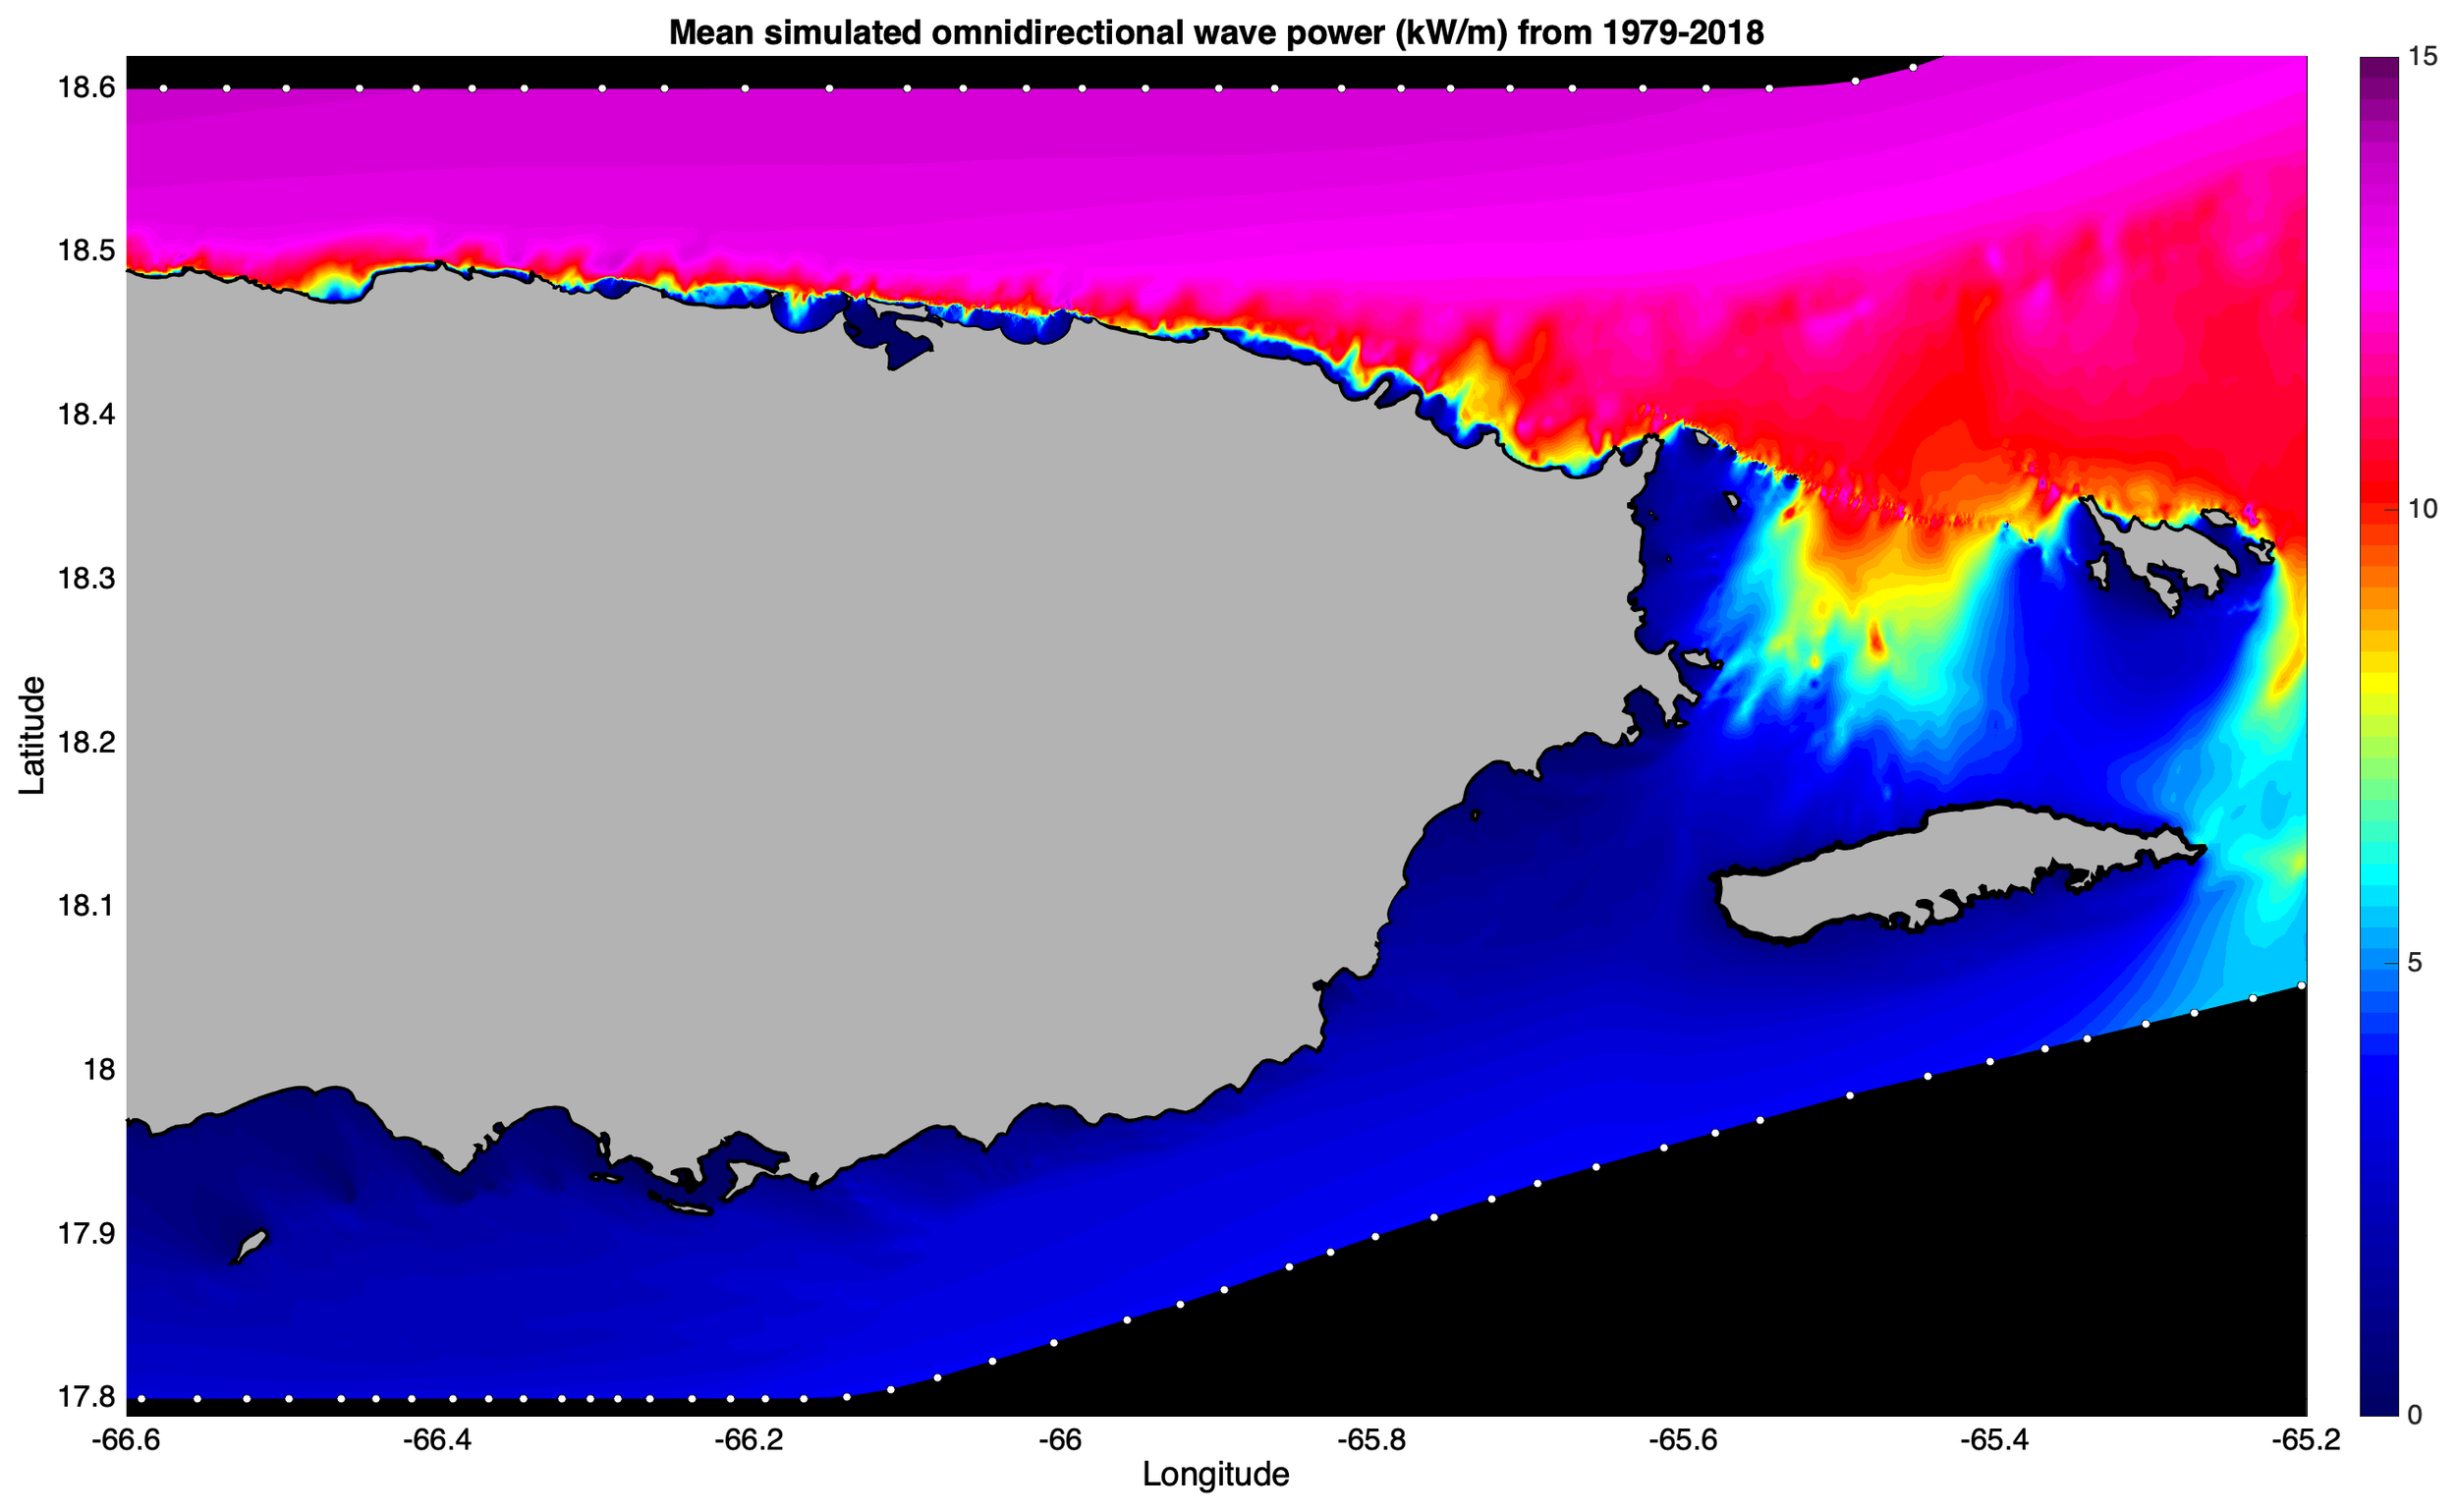
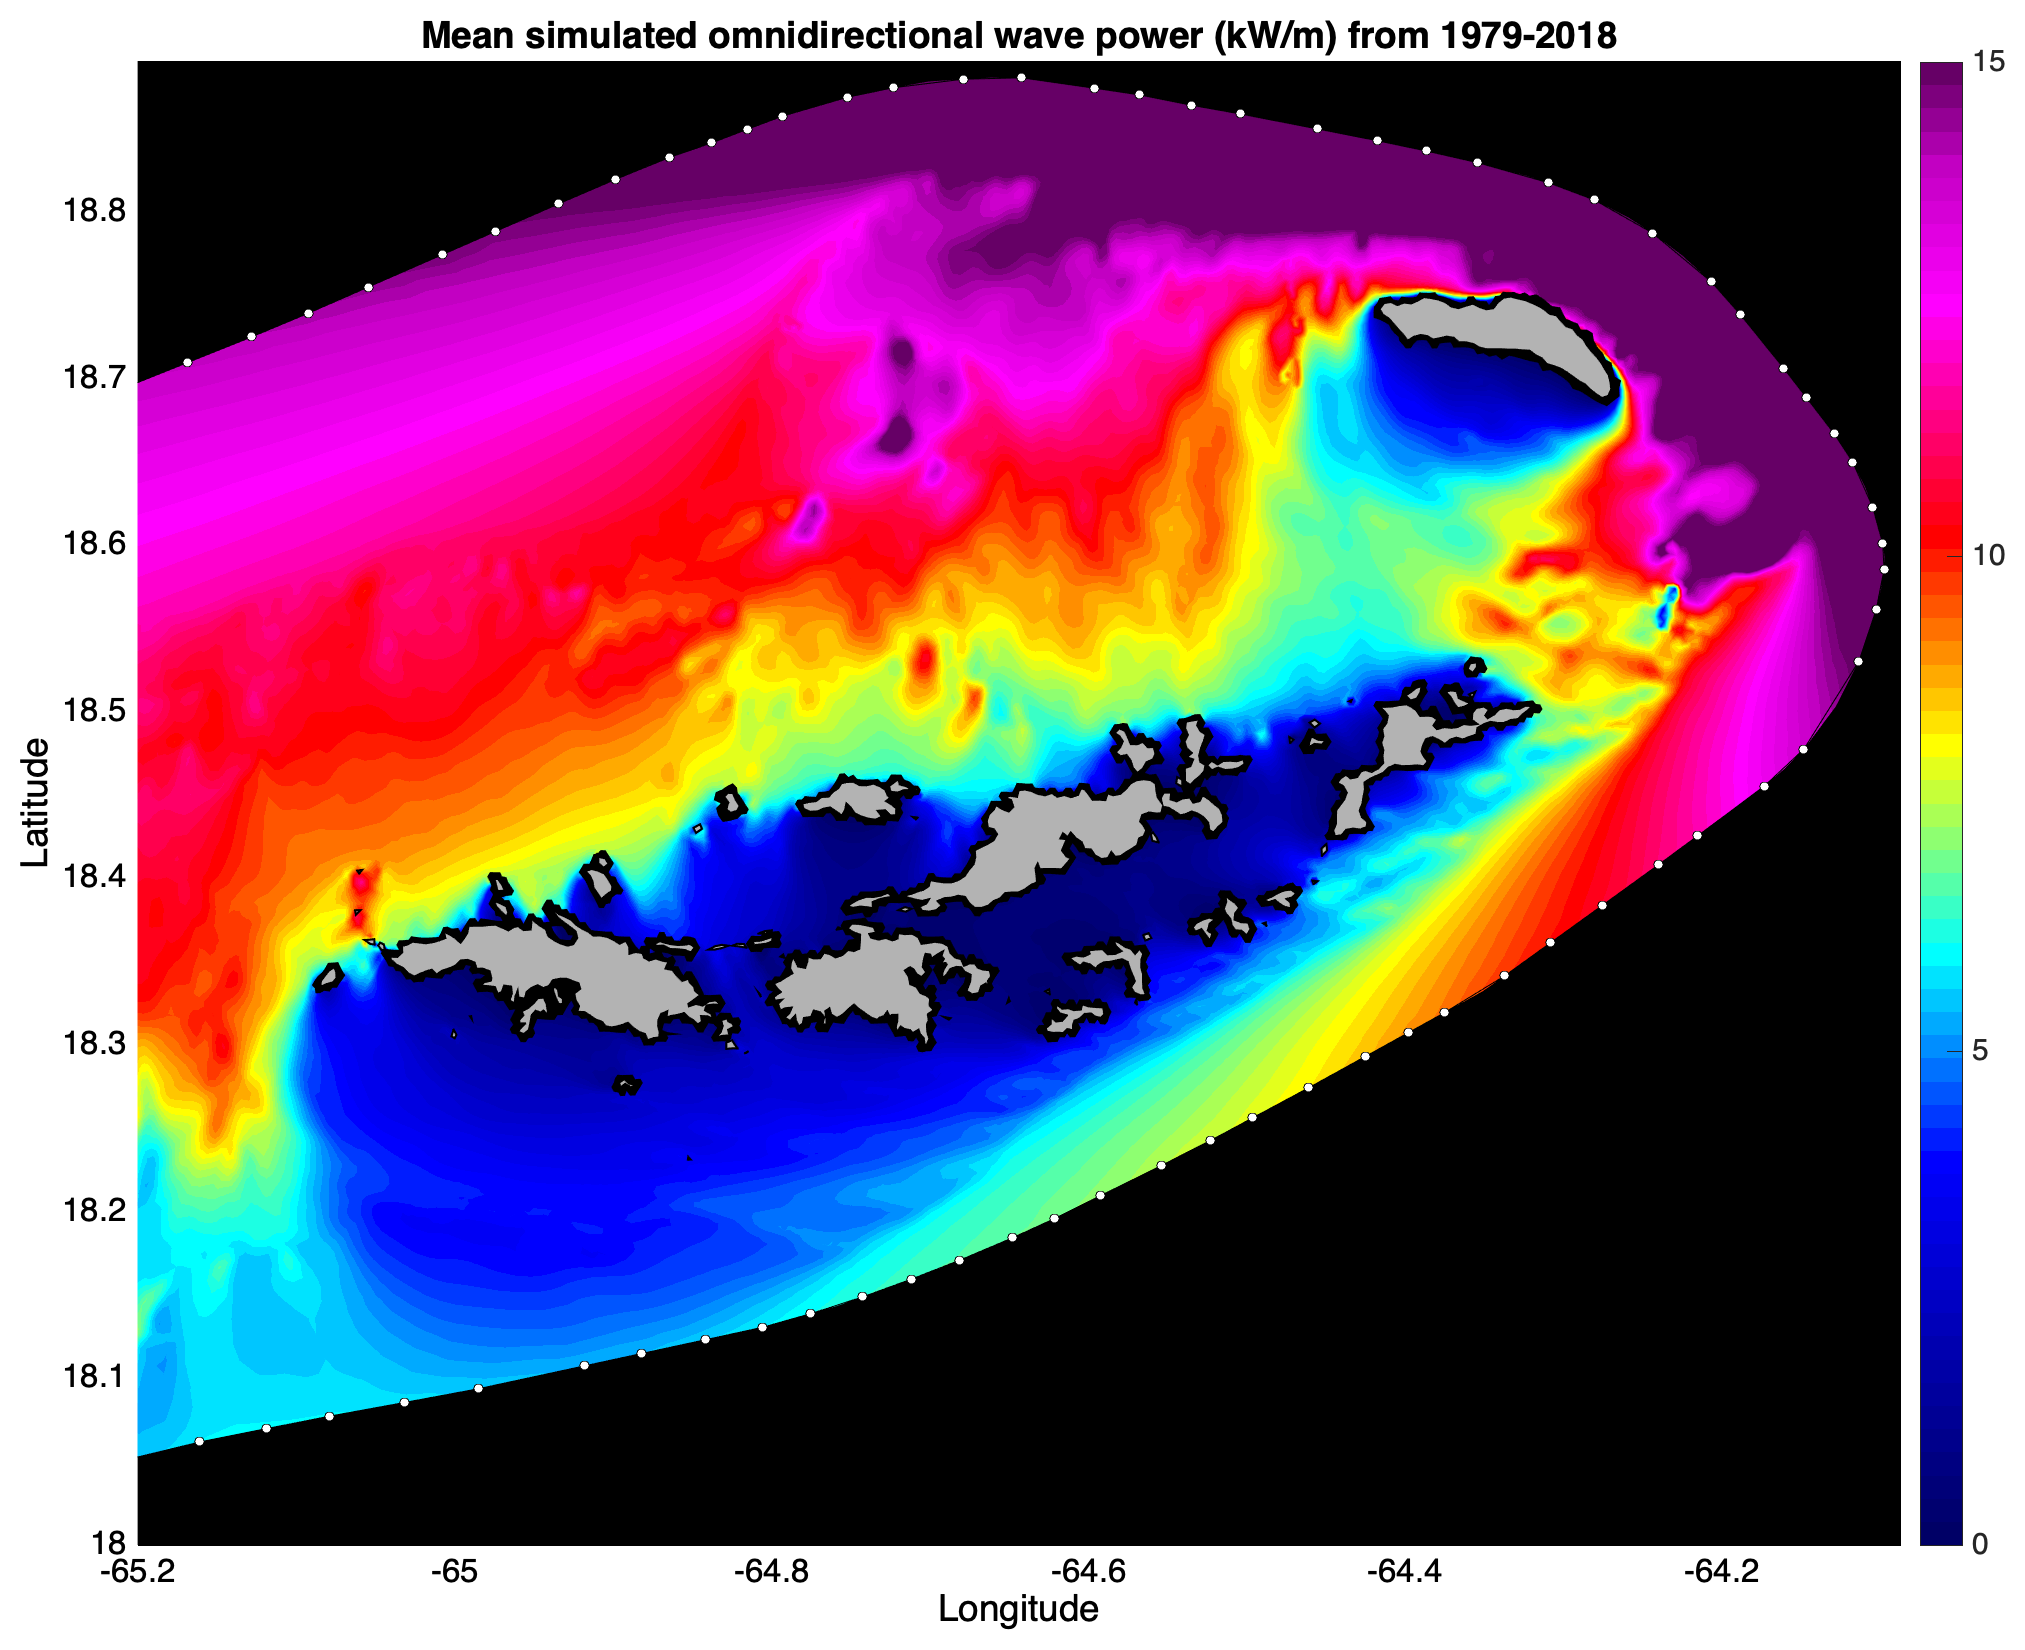
- Mean omnidirectional wave power (measured in kilowatts per meter of wave crest kW/m)
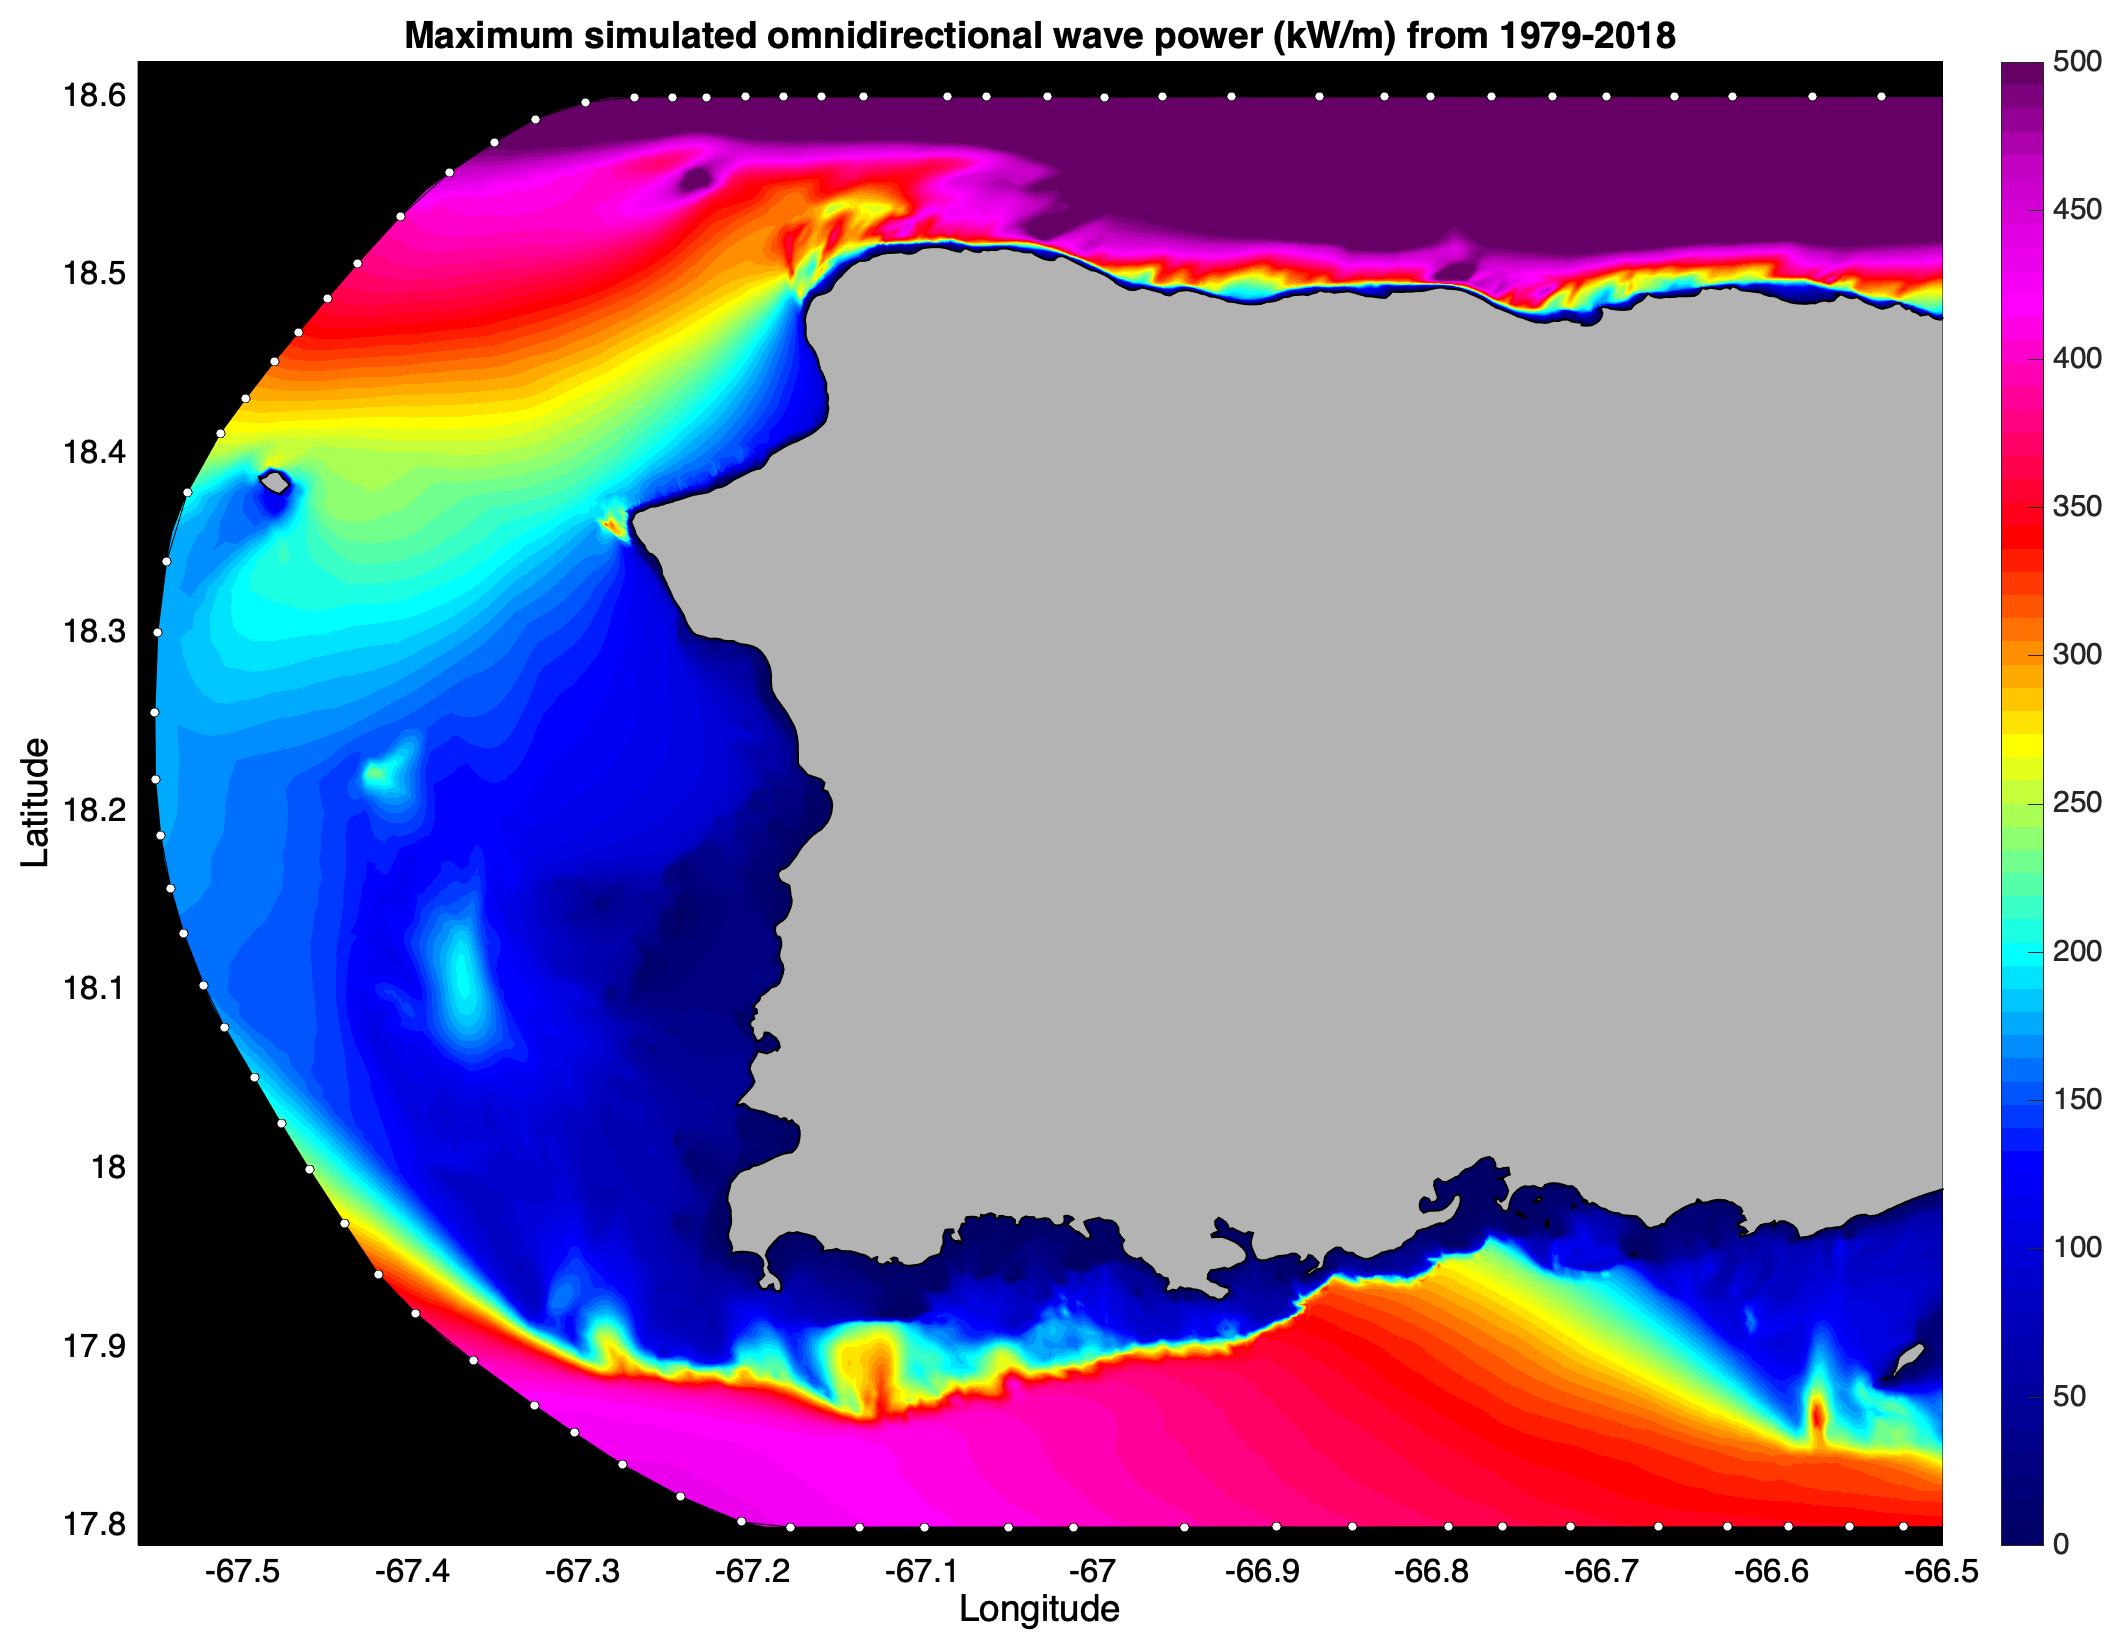
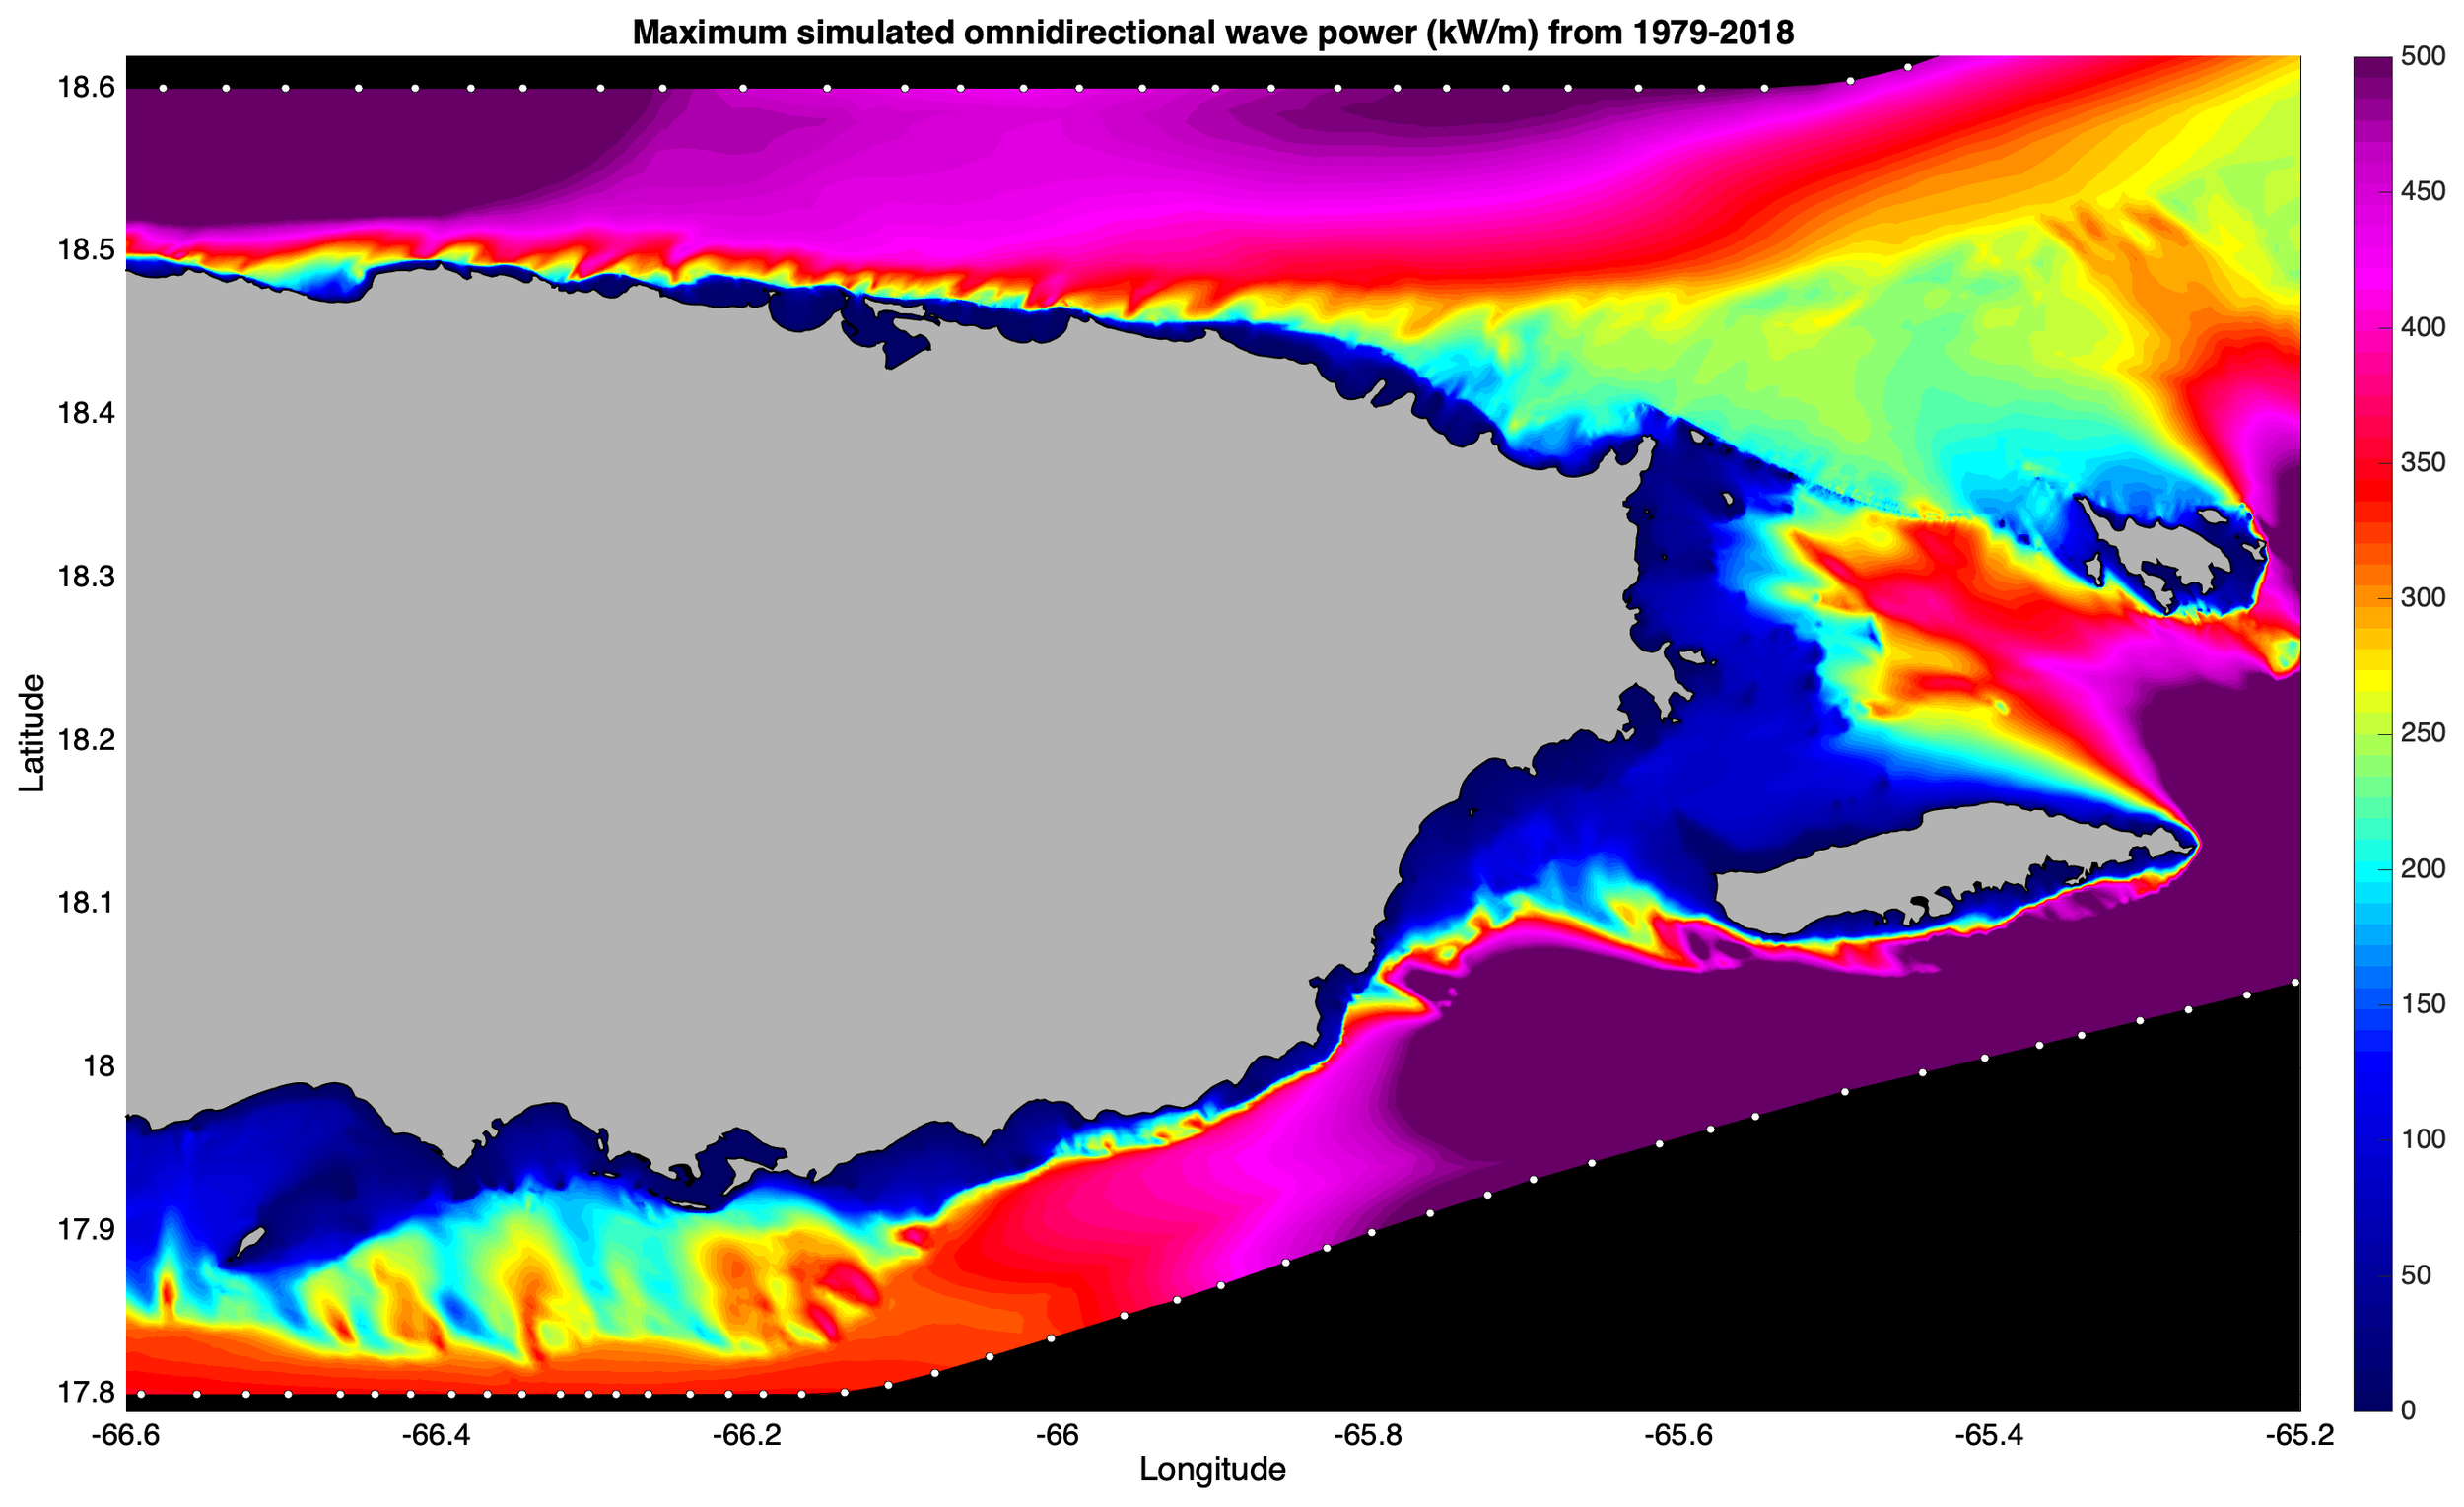
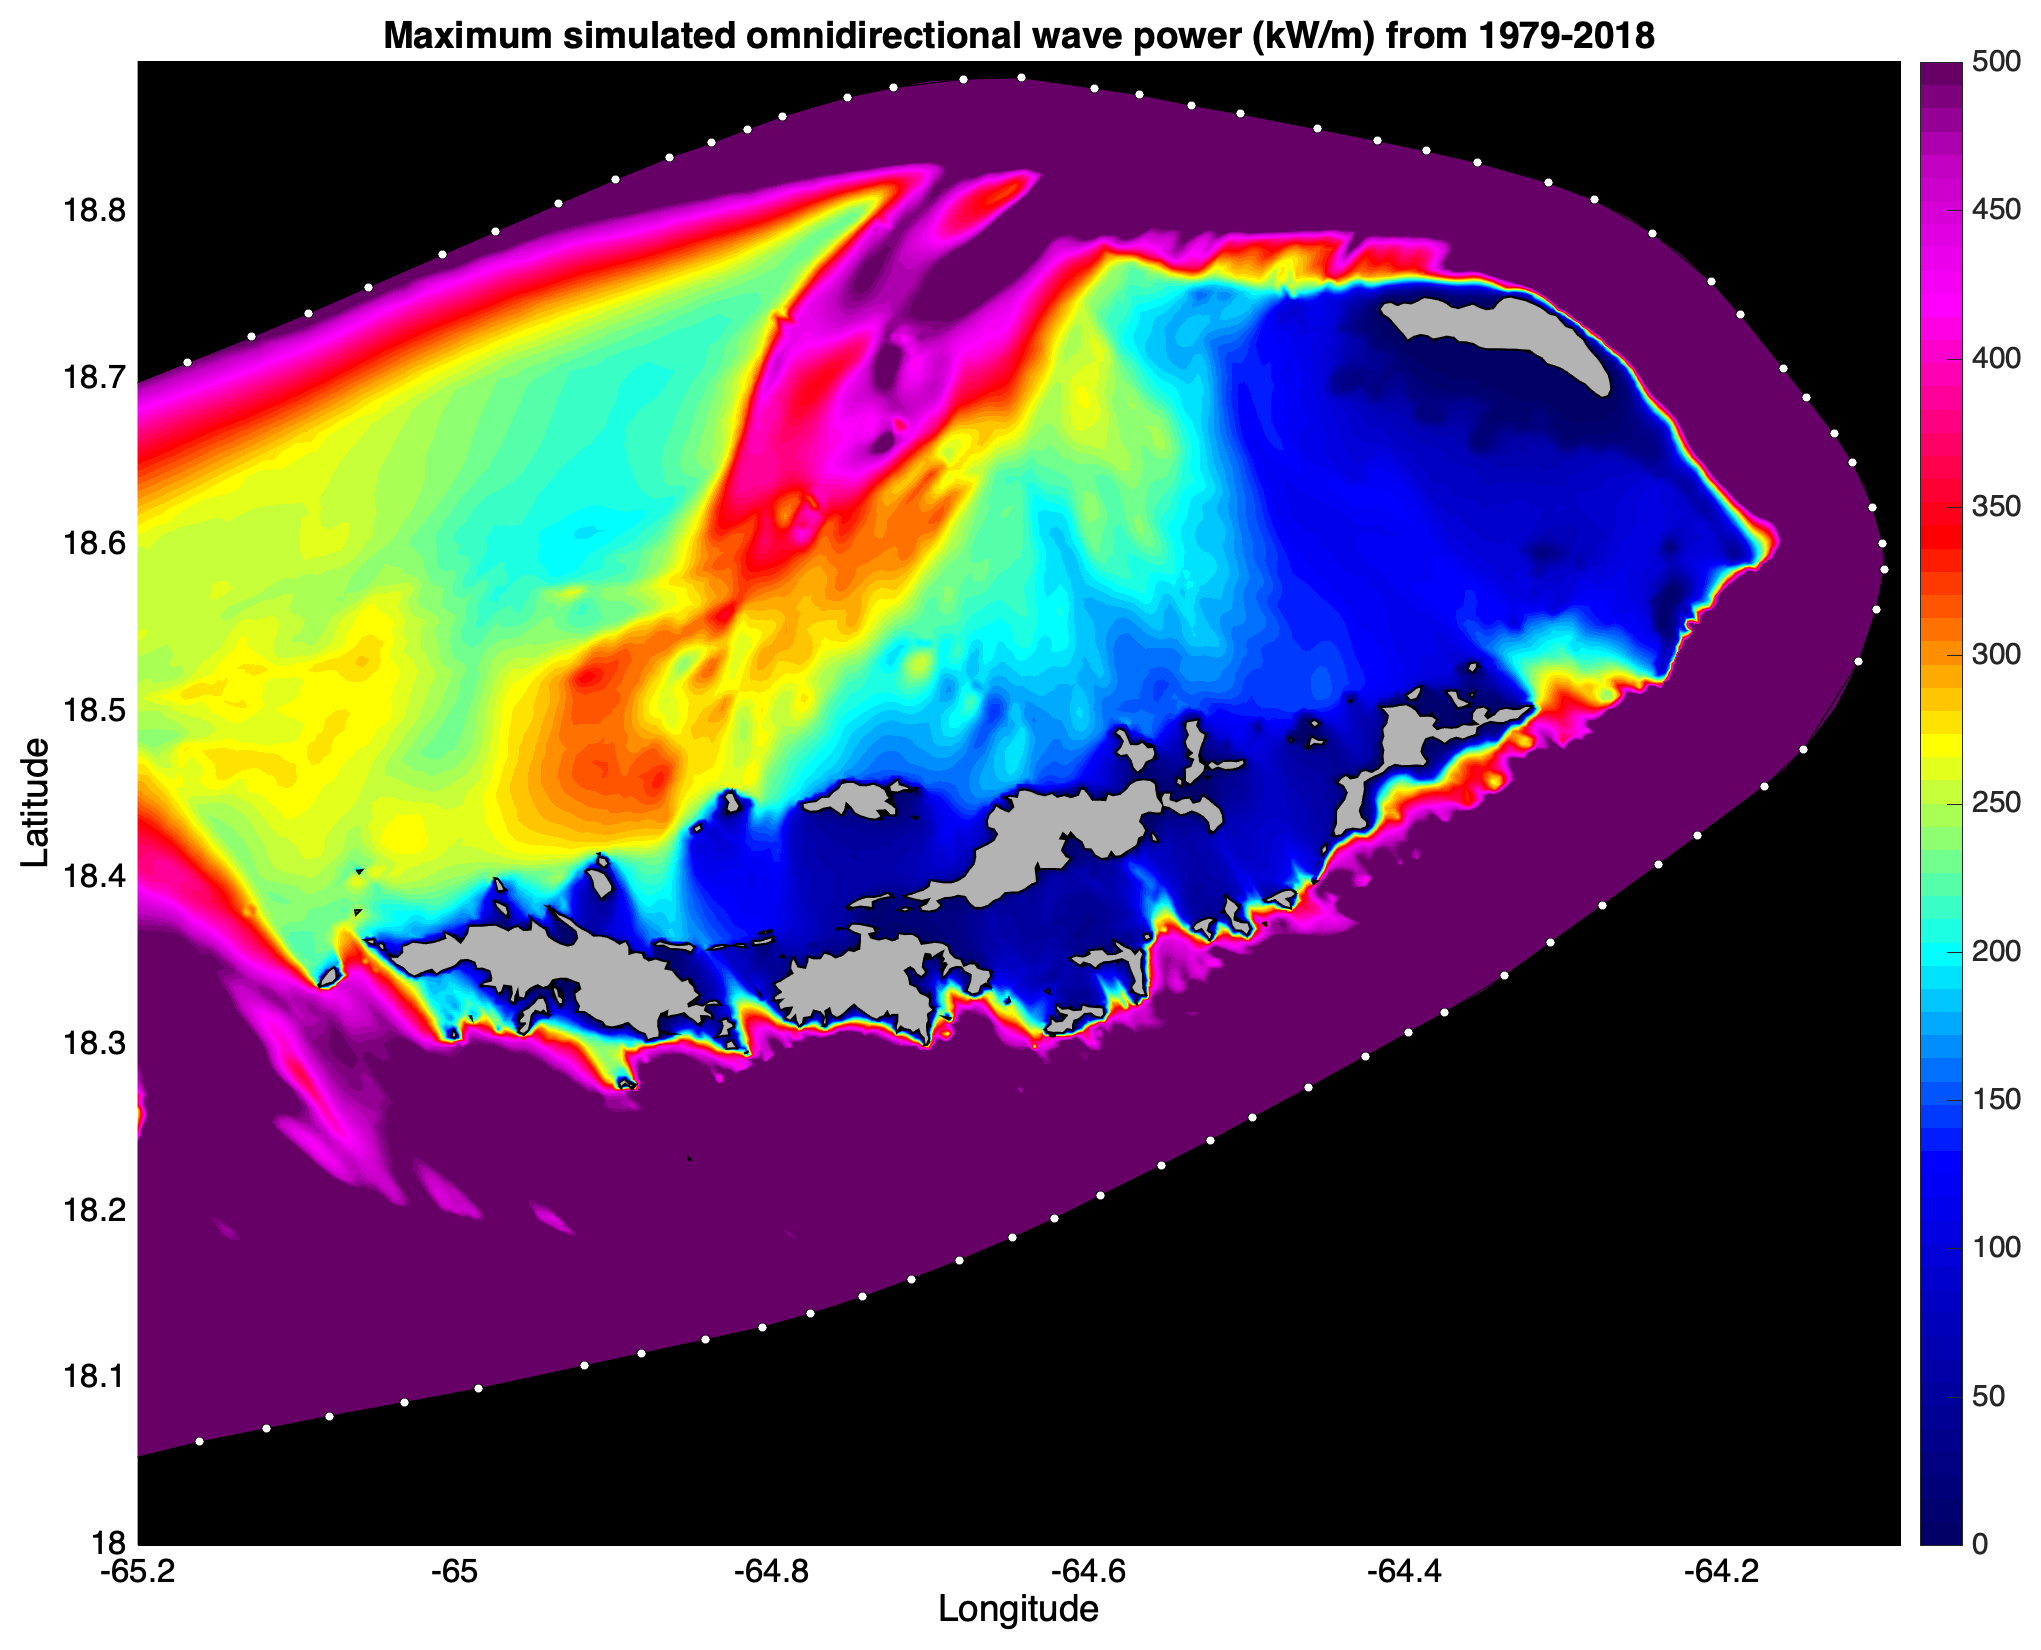
- Maximum omnidirectional wave power (measured in kilowatts per meter of wave crest kW/m)
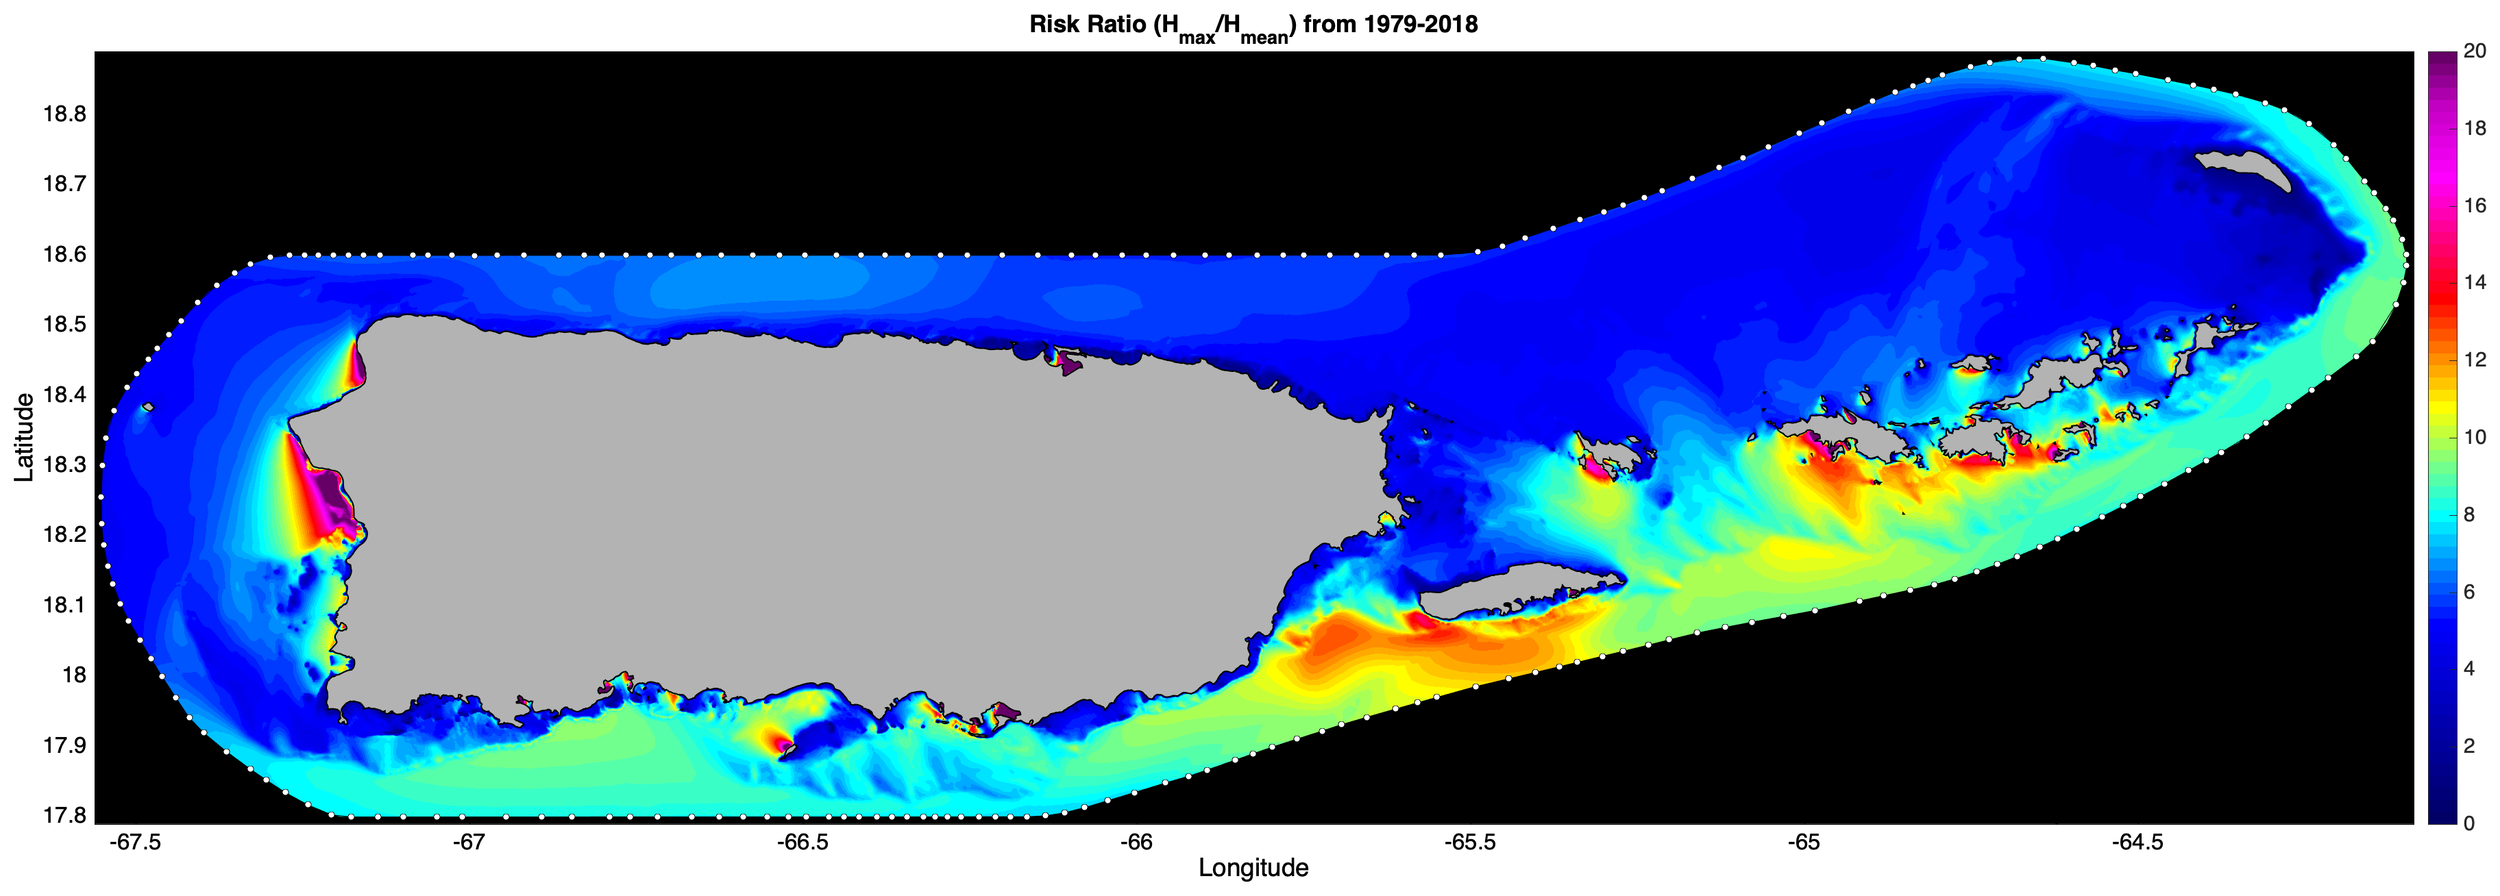
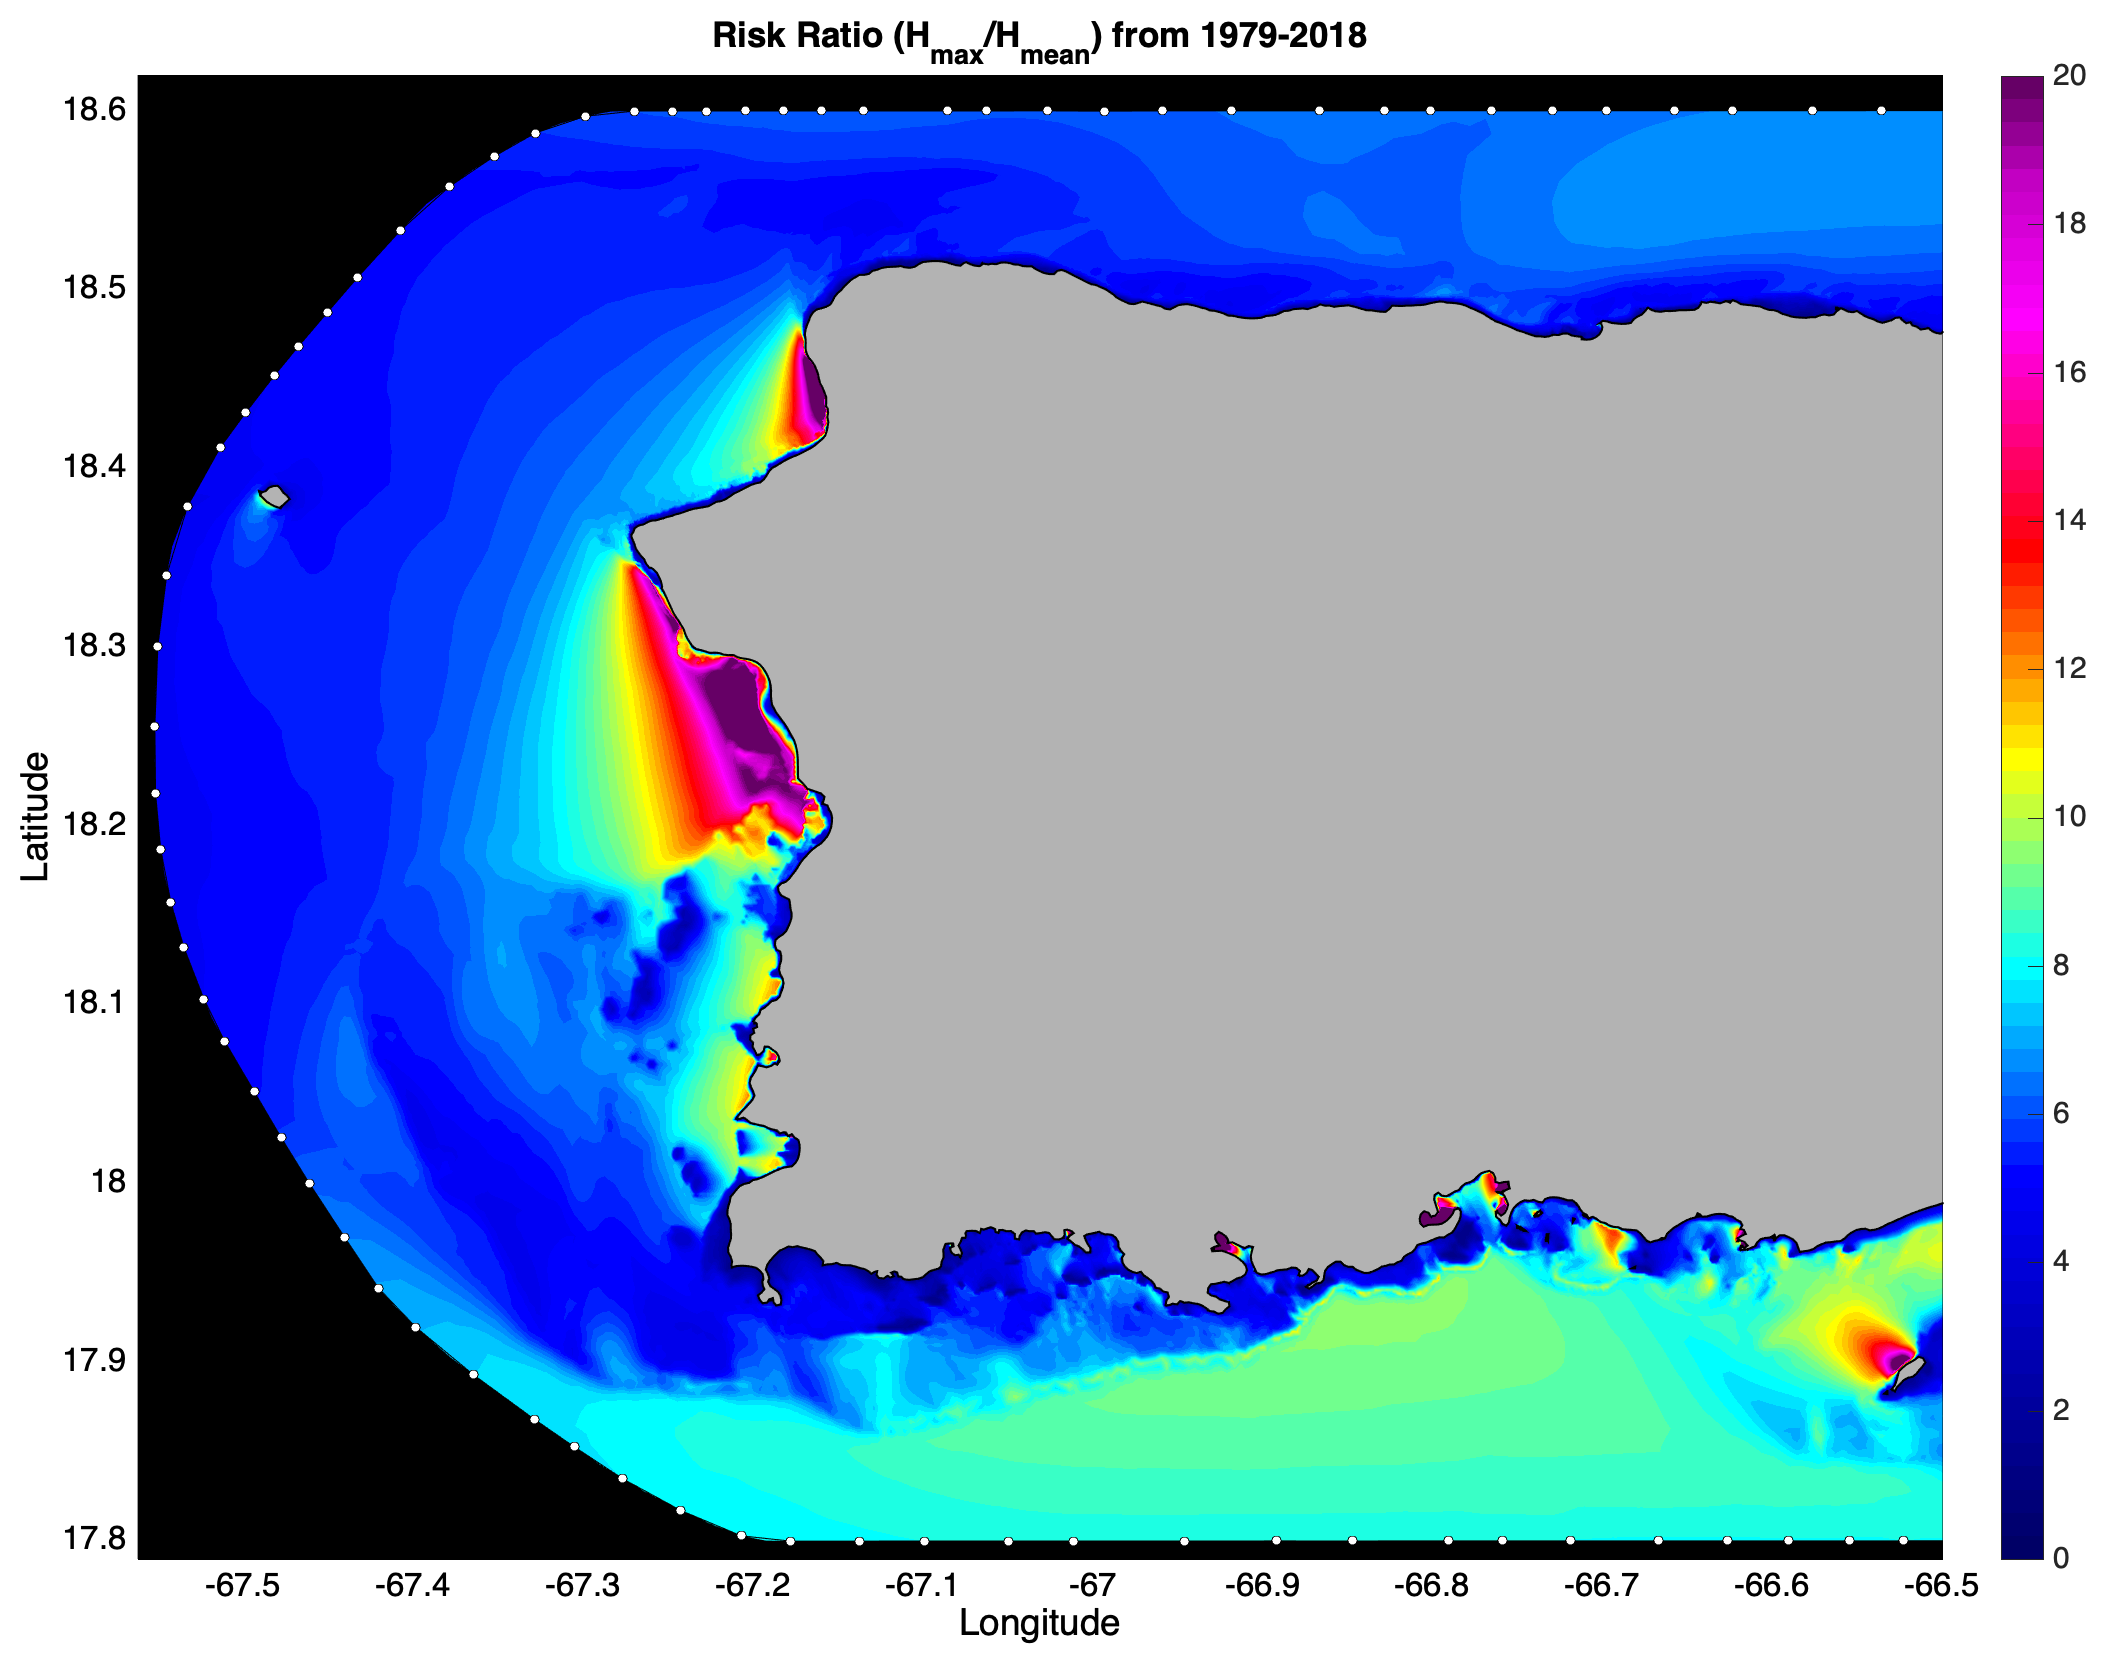
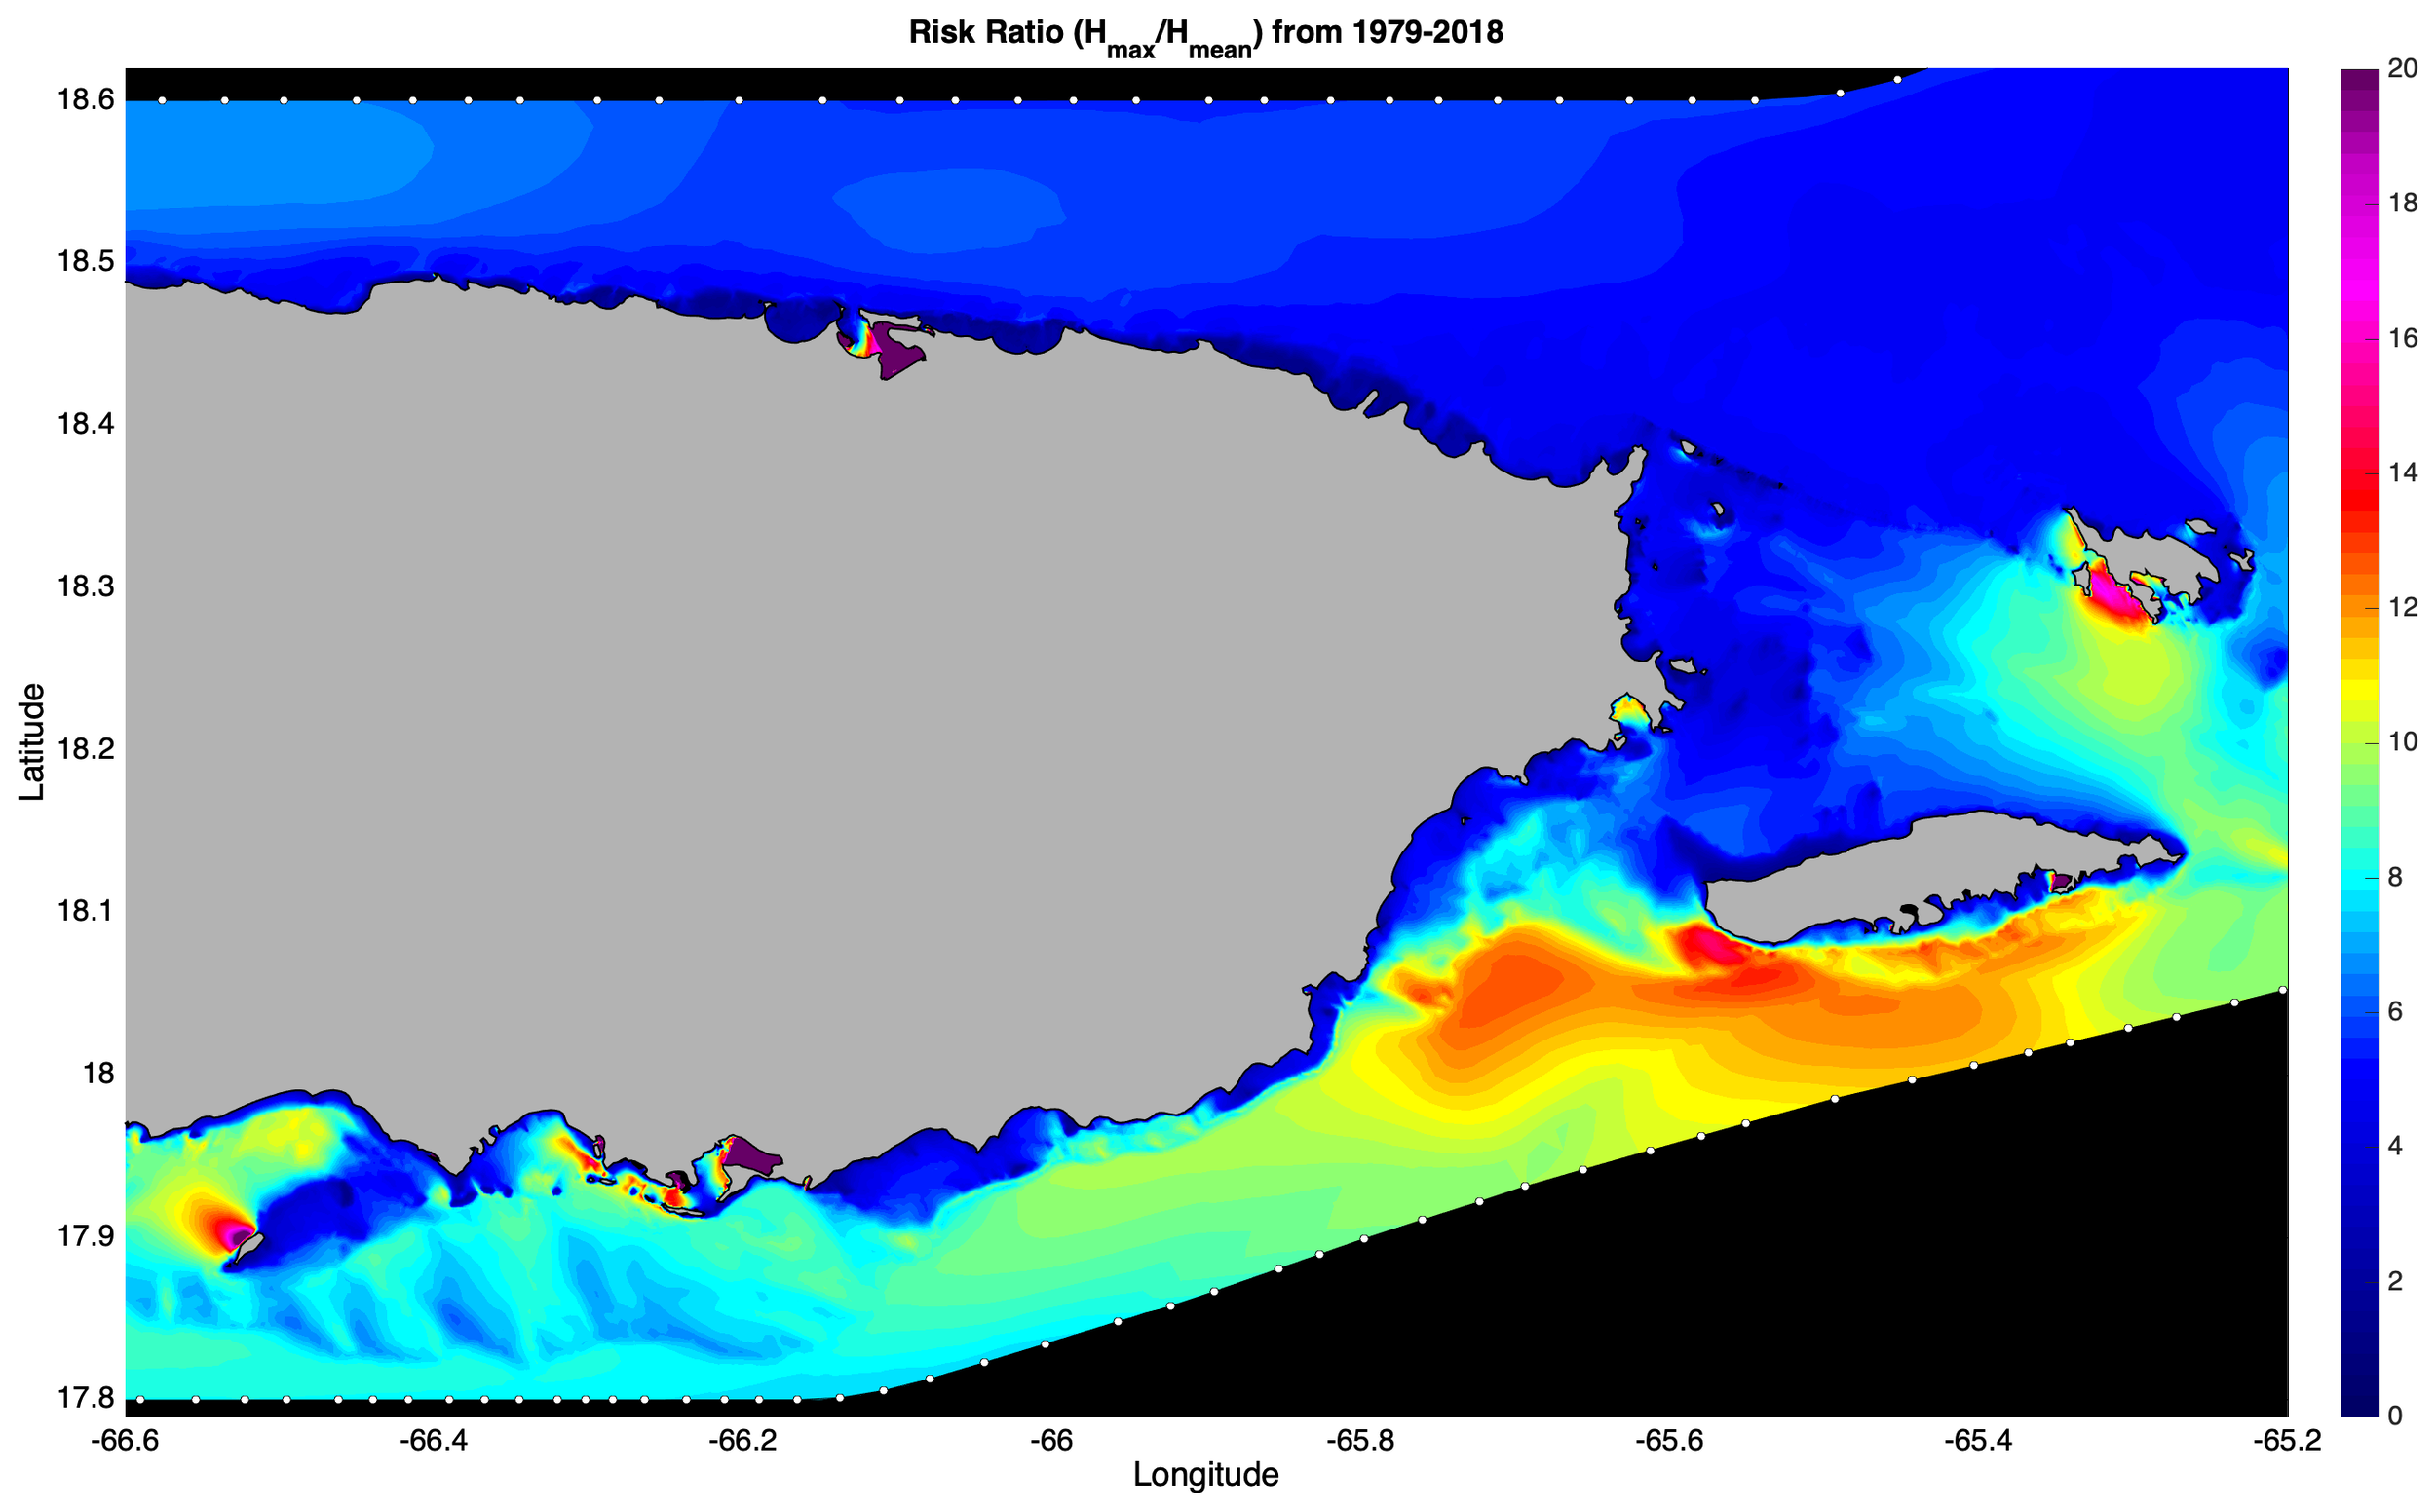
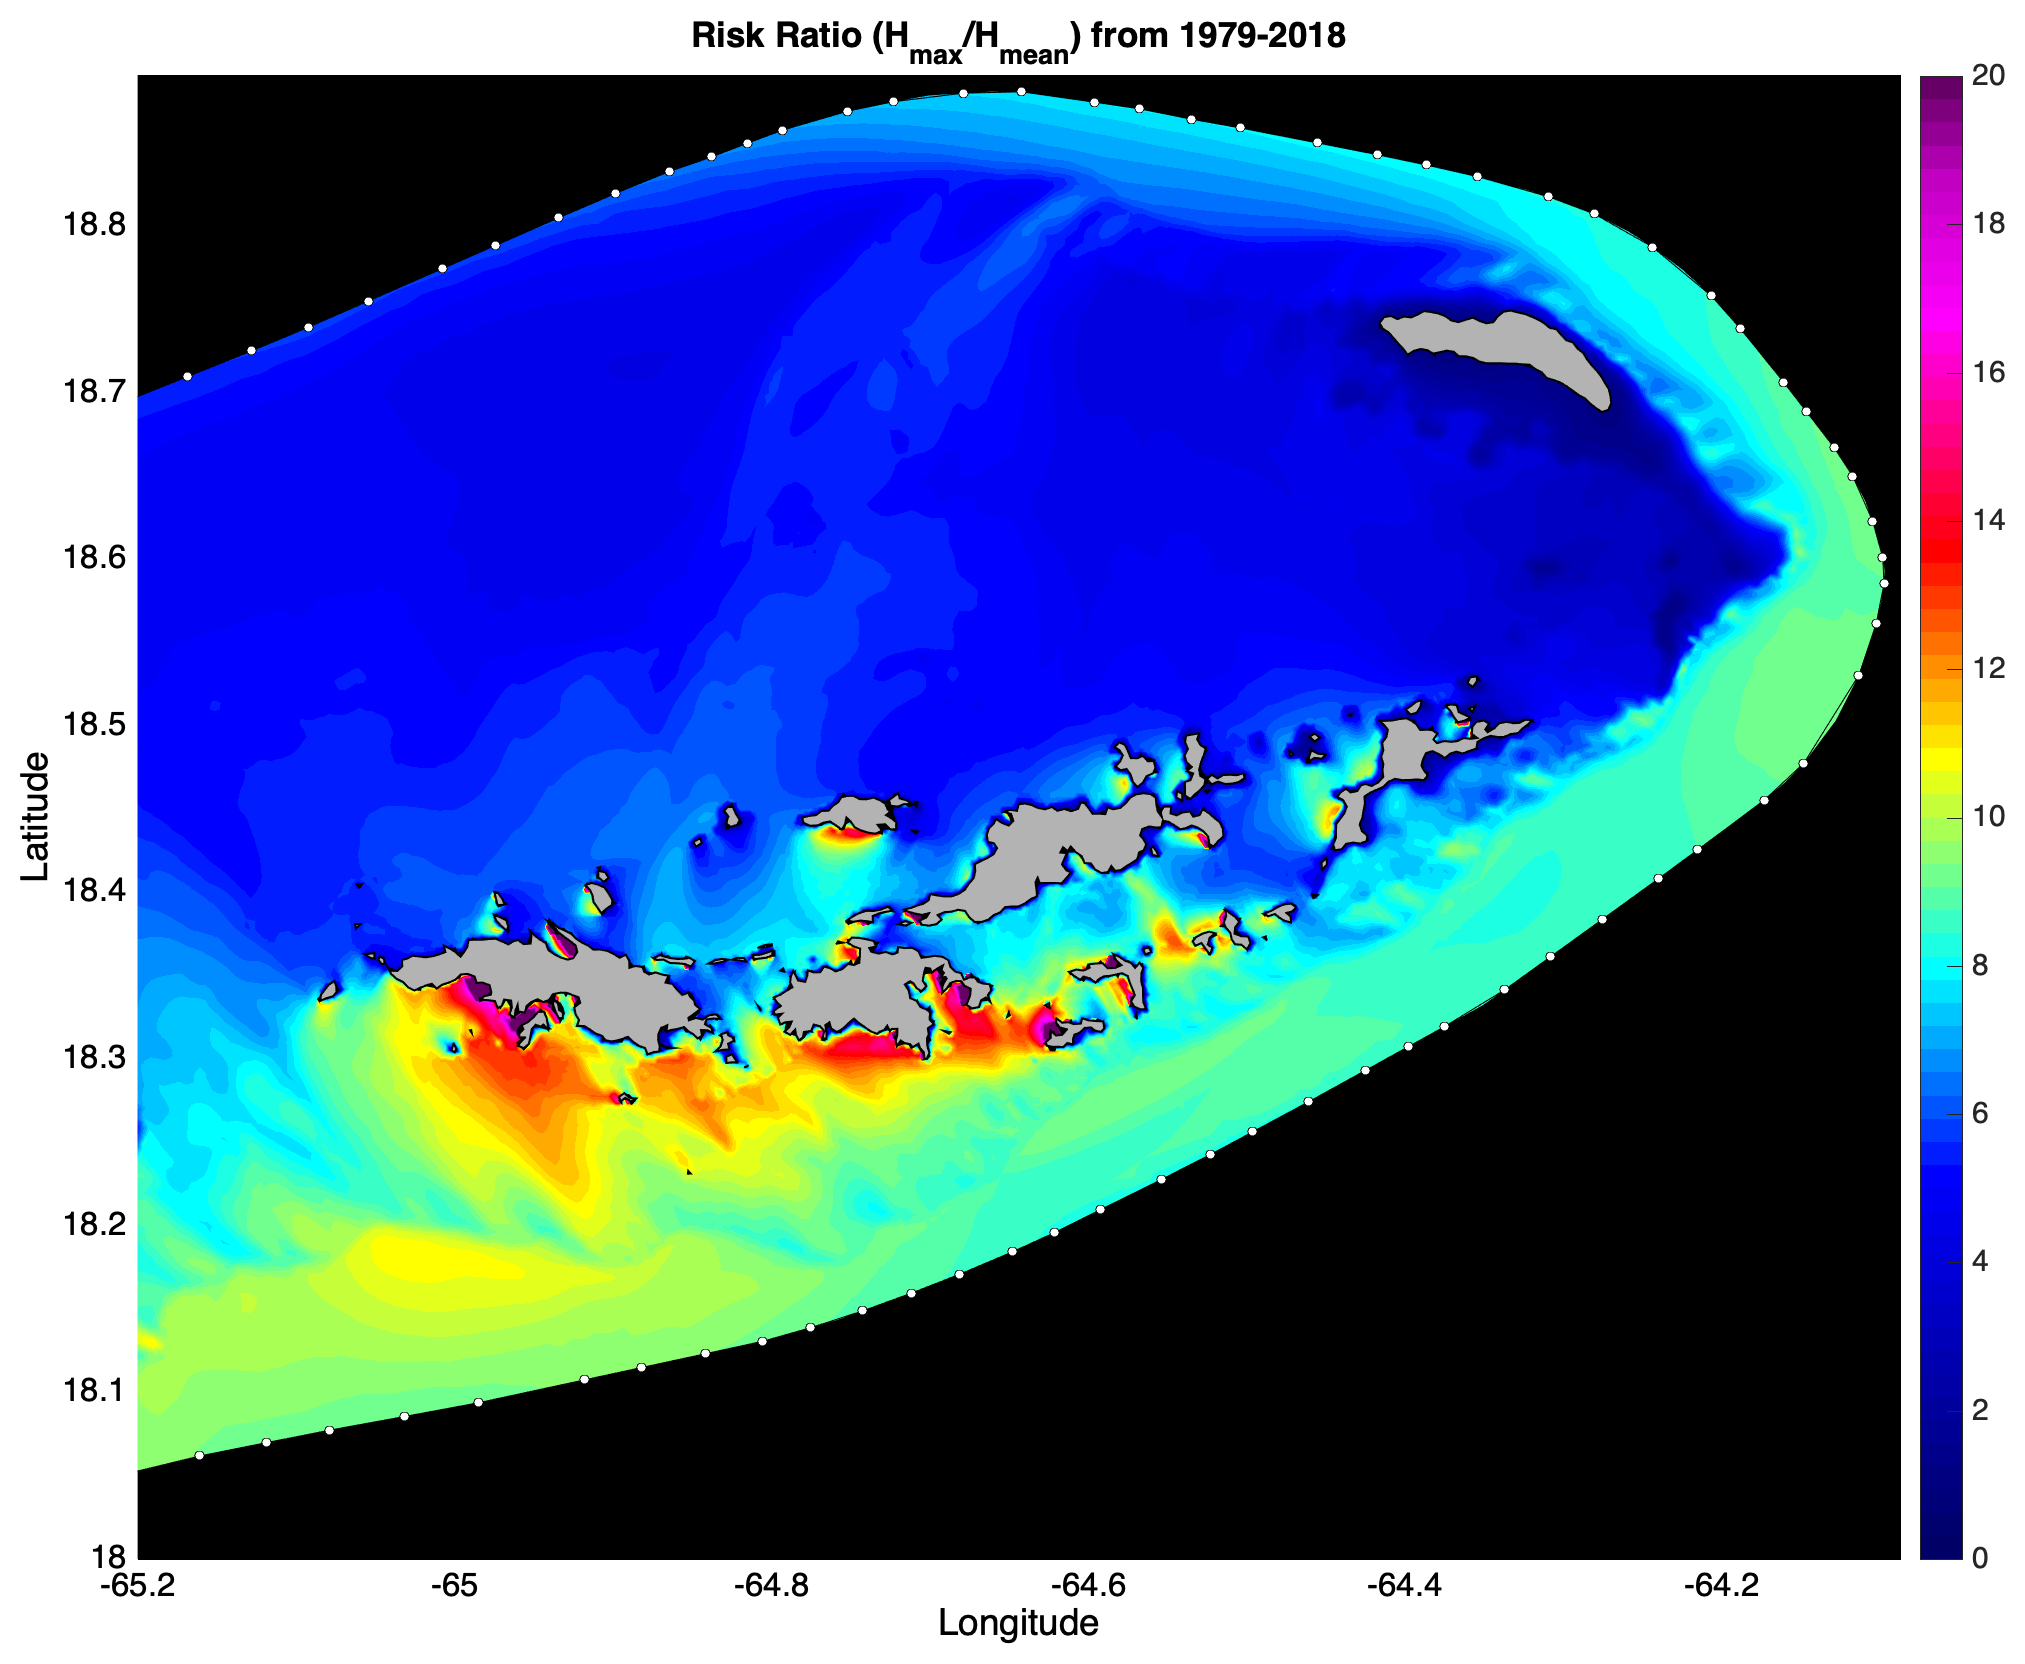
- Relative risk ratio RR = Max/Hmean (Neary et al., 2020). This quantity represents the ratio of the maximum 40-year simulated wave height at a specific location compared to the mean wave height
Figures for the full PR/USVI region and for three subregions (Western PR, Eastern PR and USVI - except St. Croix) are provided here. For custom products or for maps of specific regions please contact the Principal Investigator Miguel F Canals Silander via email: miguelf.canals@upr.edu.